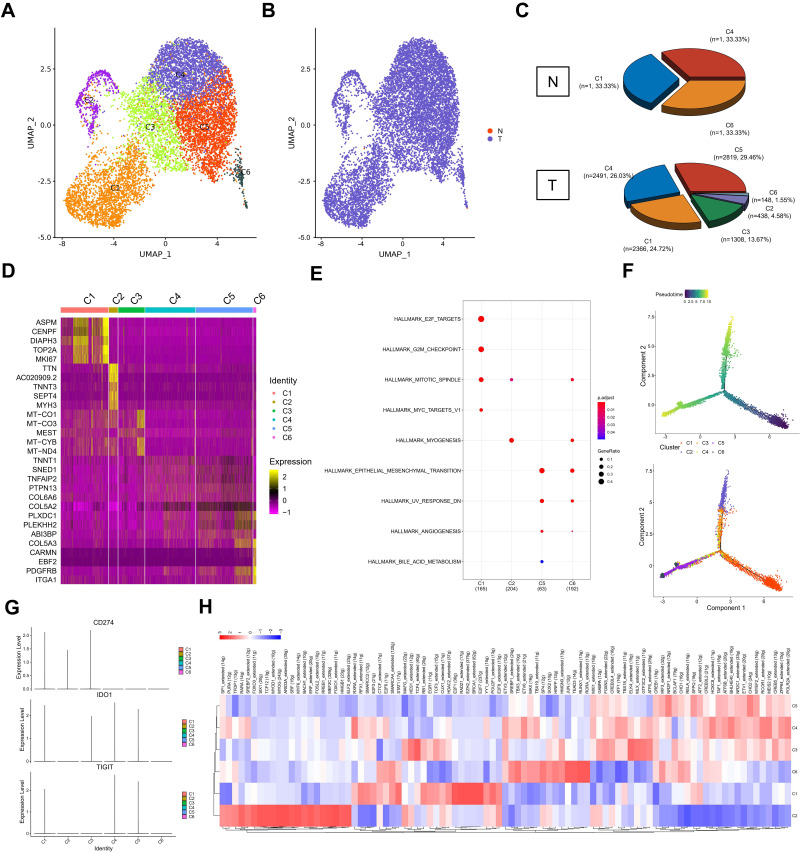
Figure 2.
Distinct clusters of malignant cells in testicular ERMS. (A and B) Six main malignant cell subclusters were identified by UMAP analysis. (C) The percentage of assigned cell types are summarized in normal and tumor tissues. (D) Heatmap of specific markers in each cell type. (E) The pathway enrichment of GSEA of the 9 hallmark gene sets in MSigDB database among the six subclusters. (F) Pseudotime was colored in a gradient from dark to light blue. The start of pseudotime is indicated by dark blue, the end of pseudotime by light blue (upper). Pseudotime trajectory of 6 subclusters was generated by Monocle2 (lower). (G) The key genes expression of immune checkpoint in 6 subclusters. (H) SCENIC analysis of 6 subclusters.

