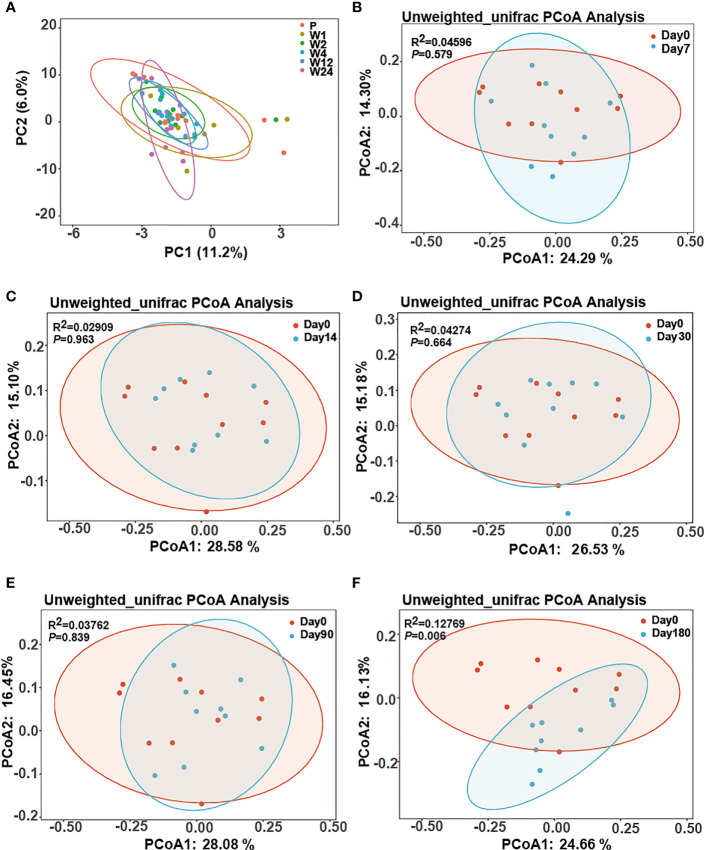
Figure 2.
The beta diversity of the GCF microbiota over time. (A) PCA (unconstrained ordination) of all samples at the six time points. (B–F) Two-dimensional diagram of the principal coordinate analysis (PCoA) of unweighted UniFrac distance metrics of the ASV abundance data from the GCF sample of peri-implantitis patients across all time points. Each sample represented by the small circle and ellipses represents the 95% confidence interval.

