Figure 3.
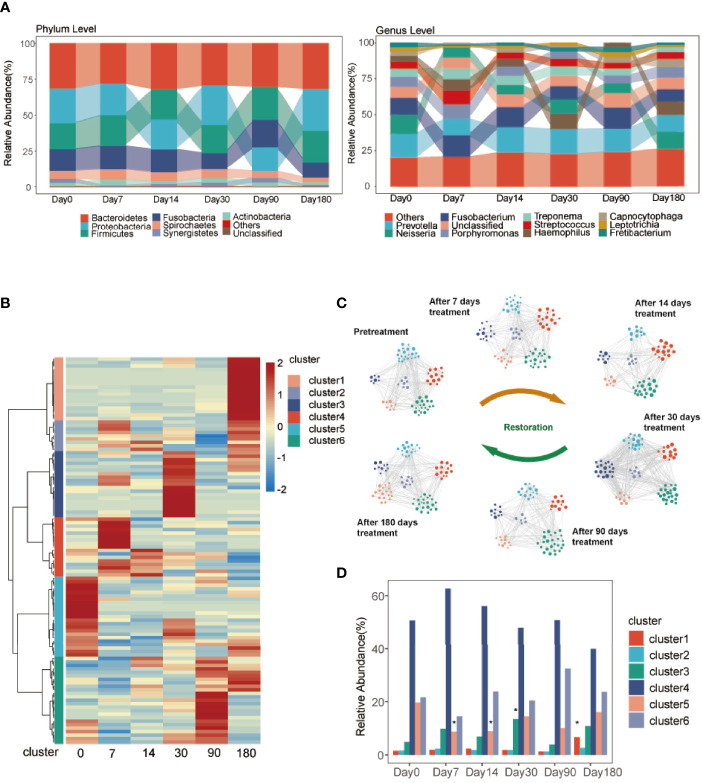
Taxonomies of GCF change over time. (A) Relative abundance of bacterial phyla and genera (top 10) over the six time points. (B) Hierarchical Ward-linkage clustering based on the Pearson correlation coefficients of the genera among six time points. The left panel shows hierarchical Ward-linkage clustering based on Pearson correlation coefficients of the genera, colored by the co-abundance groups (cluster). (C) The microbiota network of the clusters at the genus level. The size of the node represents the relative abundance of the genus. The color of the node represents the cluster identified in (B). The edges are filtered with Spearman coefficients >0.7, P < 0.05, FDR <10%. (D) The relative abundance of clusters at the six time points. Significance was measured using the Wilcoxon rank-sum test (P < 0.05, *).

