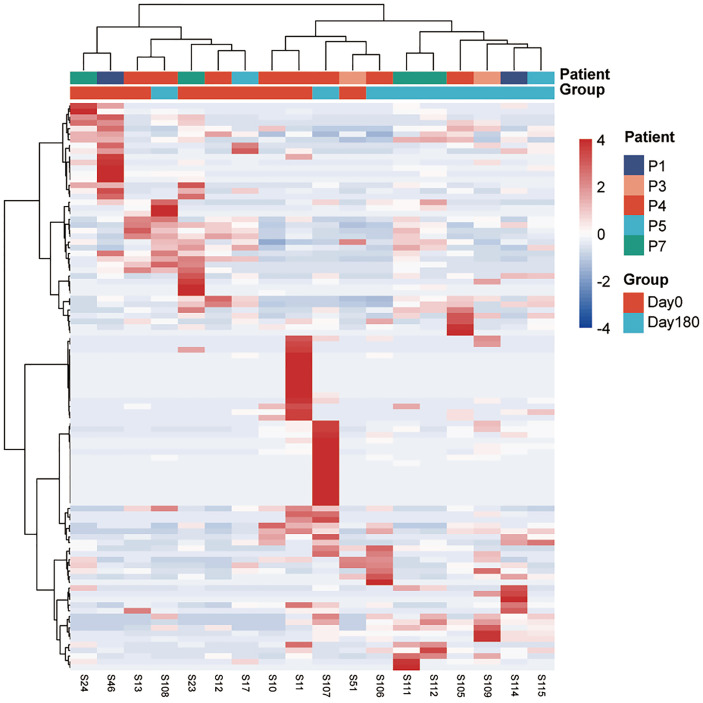
Figure 4.
A heatmap of the relative abundances of ASVs between the 180 days after-treatment group and pre-treatment group (day 0). The top panel shows hierarchical Ward-linkage clustering based on Ward.D distance of all the 18 samples, colored by the groups and patients. The left panel shows hierarchical Ward-linkage clustering based on Pearson correlation coefficients of the genera.

