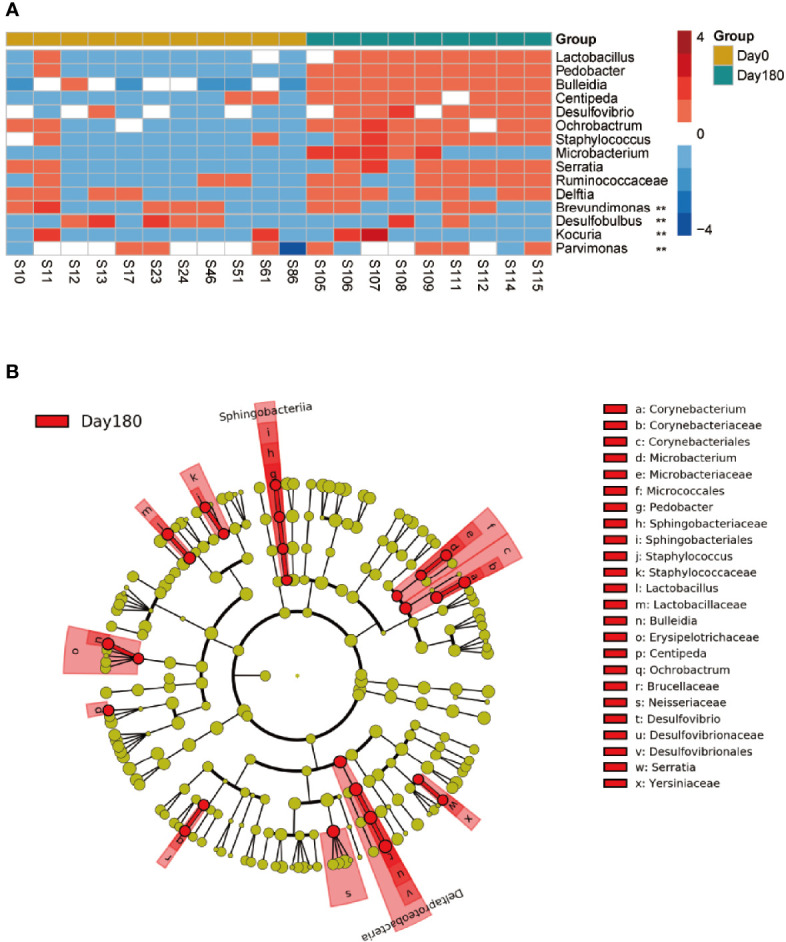
Figure 5.

Different taxa between the pre-treatment group (day 0) and the 180 days after-treatment group. (A) Significantly different genera of day 0 compared with the 180 days after-treatment group. Wilcoxon rank-sum test with false discovery rate correction (P < 0.05, **). (B) Taxonomic LEfSe cladogram obtained using linear discriminant analysis (LDA) effect size (LEfSe) analysis. LEfSe identified the taxa with the greatest differences in abundance between the 180 days after-treatment group and day 0. Only taxa meeting a significant LDA threshold value of >2 are shown.
