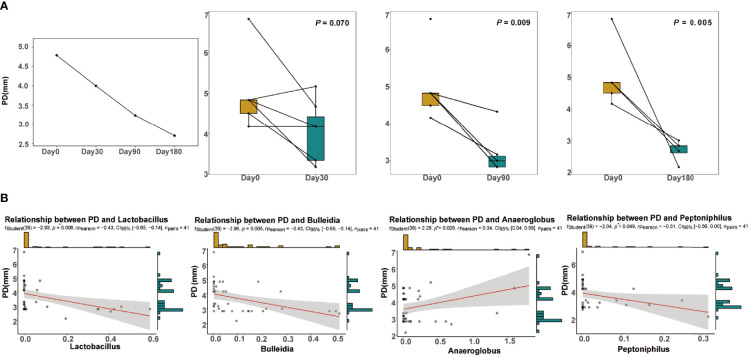
Figure 6.
Clinical information. (A) Changes in the average probing depth (PD) over time at the four time points. Significance was measured using Wilcoxon rank-sum test between each time point and before treatment (P < 0.05). (B) The linear regression of PD against the relative abundance of the genera Lactobacillus, Bulleidia, Anaeroglobus, and Peptoniphilus. The 0.95 confidence interval is displayed.

