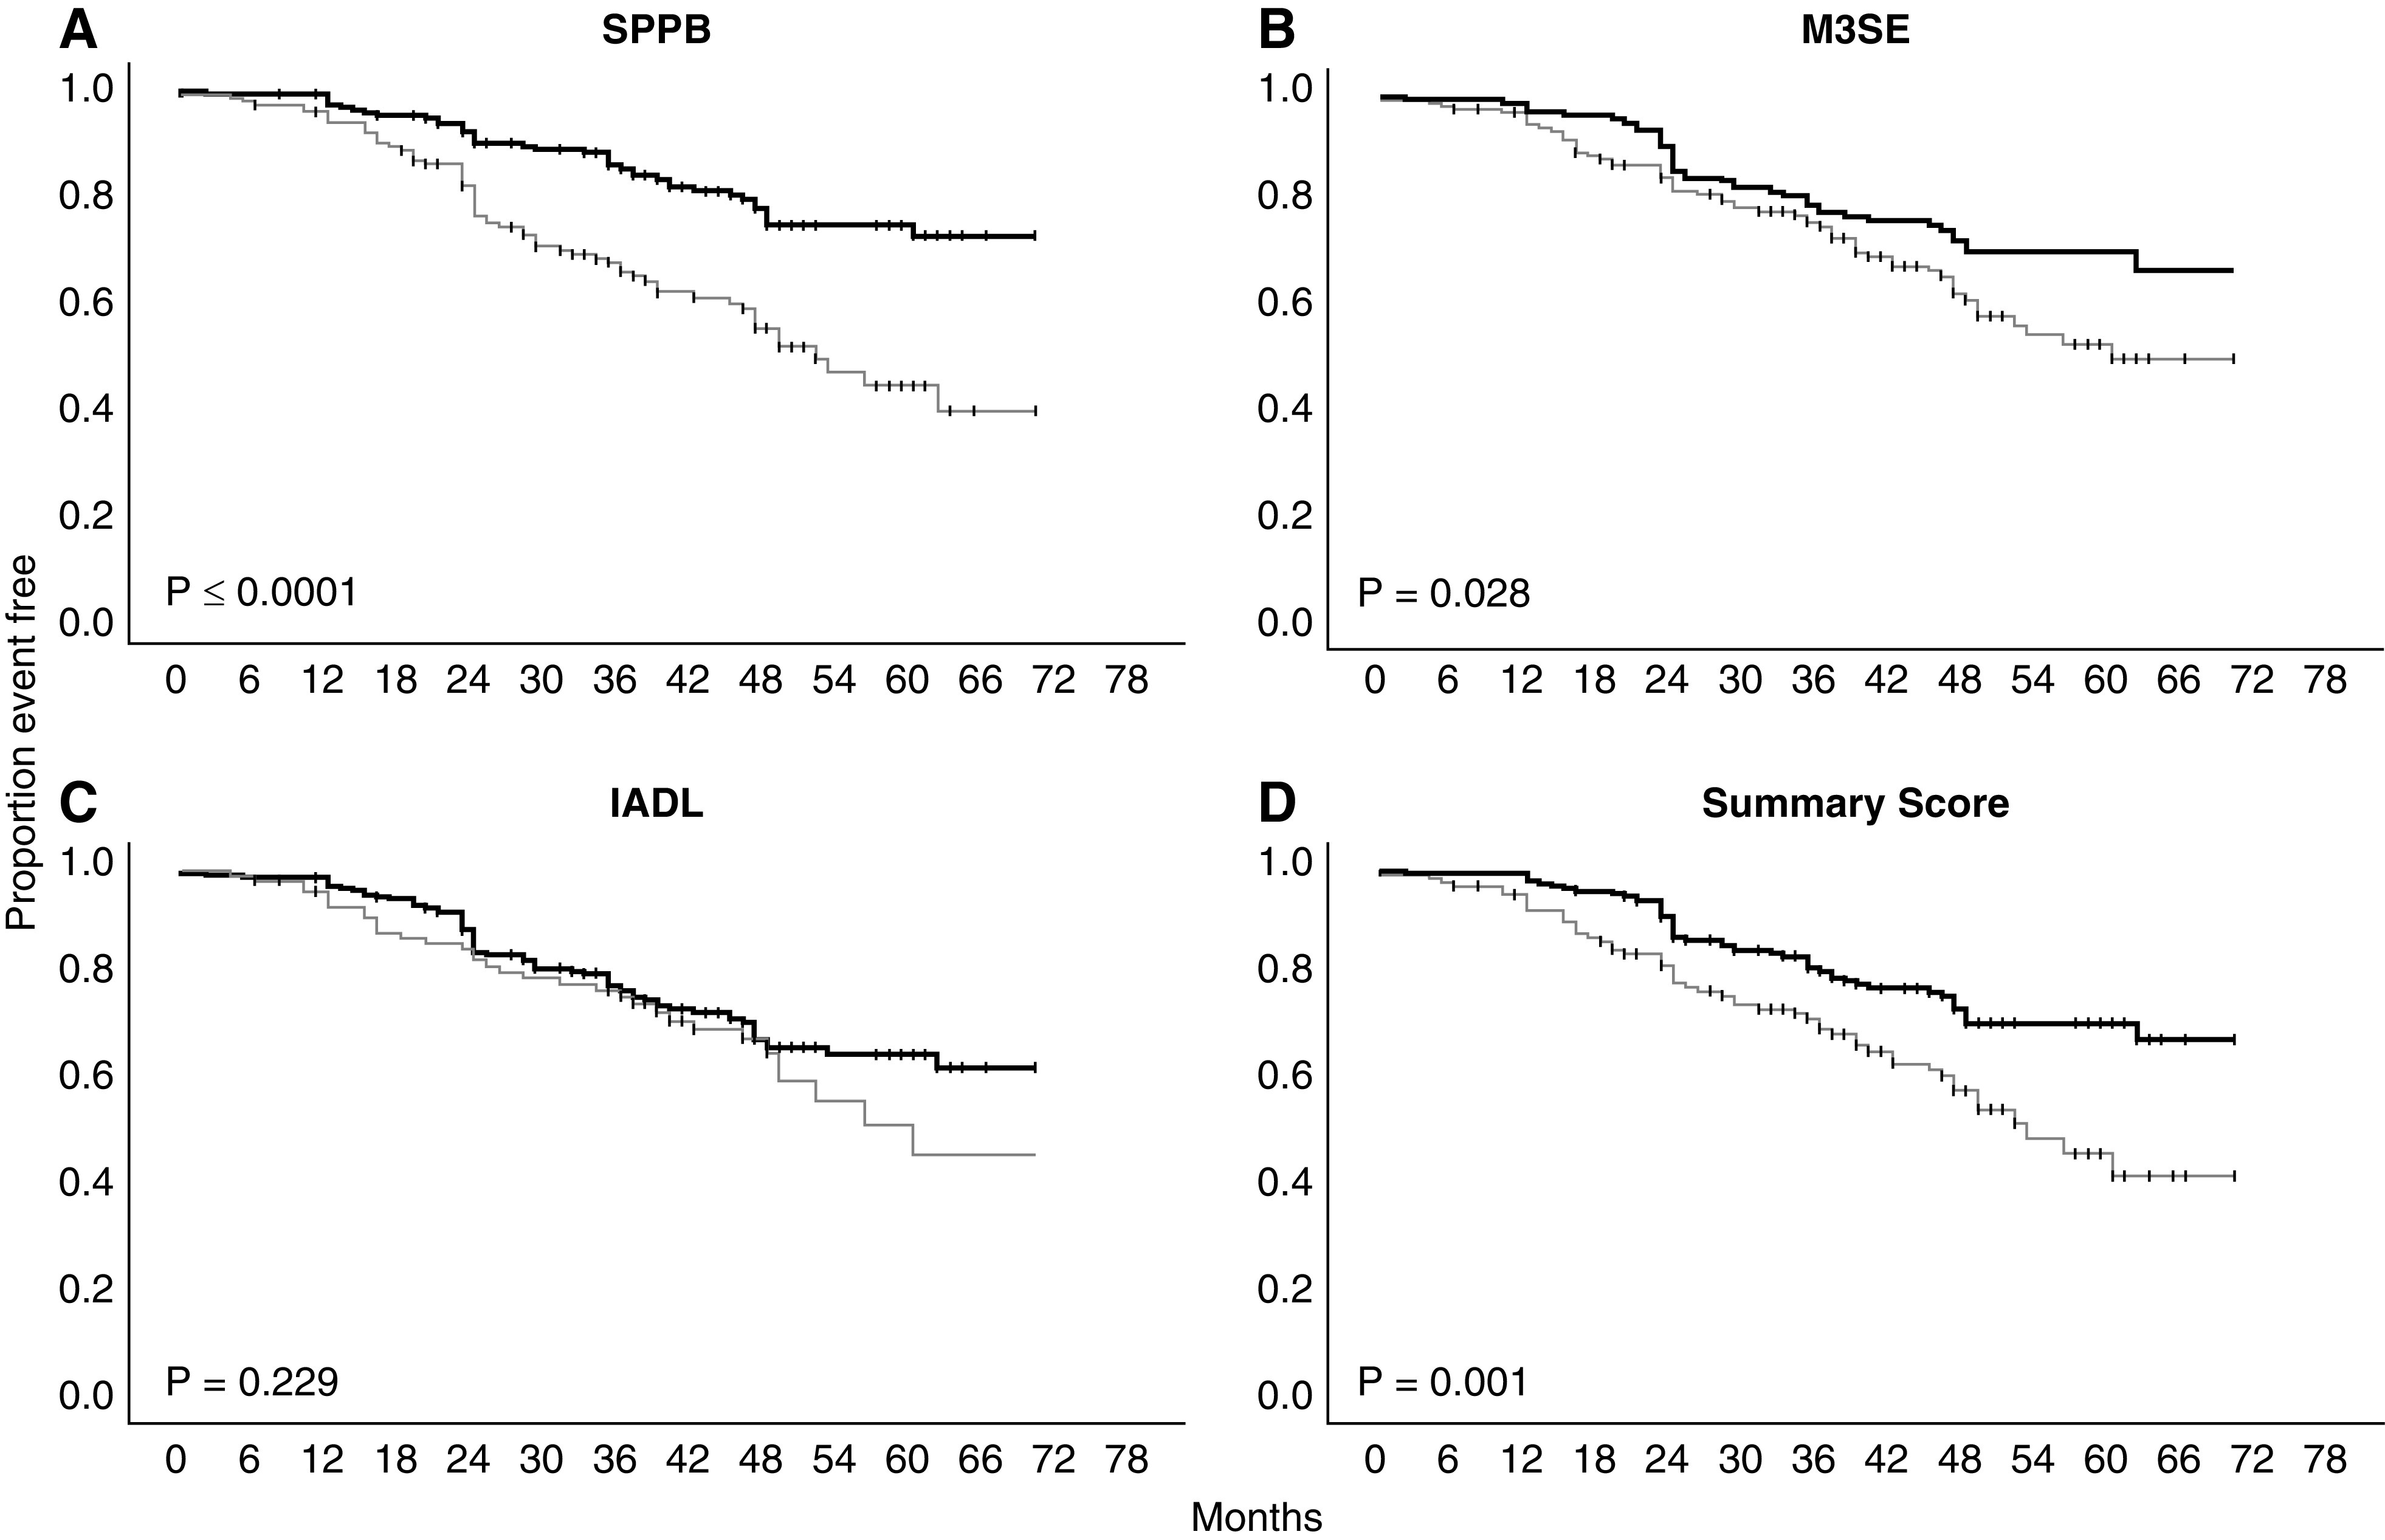
Figure 2.

Kaplan–Meier plots of high (thick line) versus low-performance (thin line) groups for each performance-based functional assessment and a summary of all with the composite outcome. Log-rank statistic P value. IADL, Lawton Instrumental Activities of Daily Living; M3SE, Modified Mini-Mental Status Exam; SPPB, Short Physical Performance Battery.
