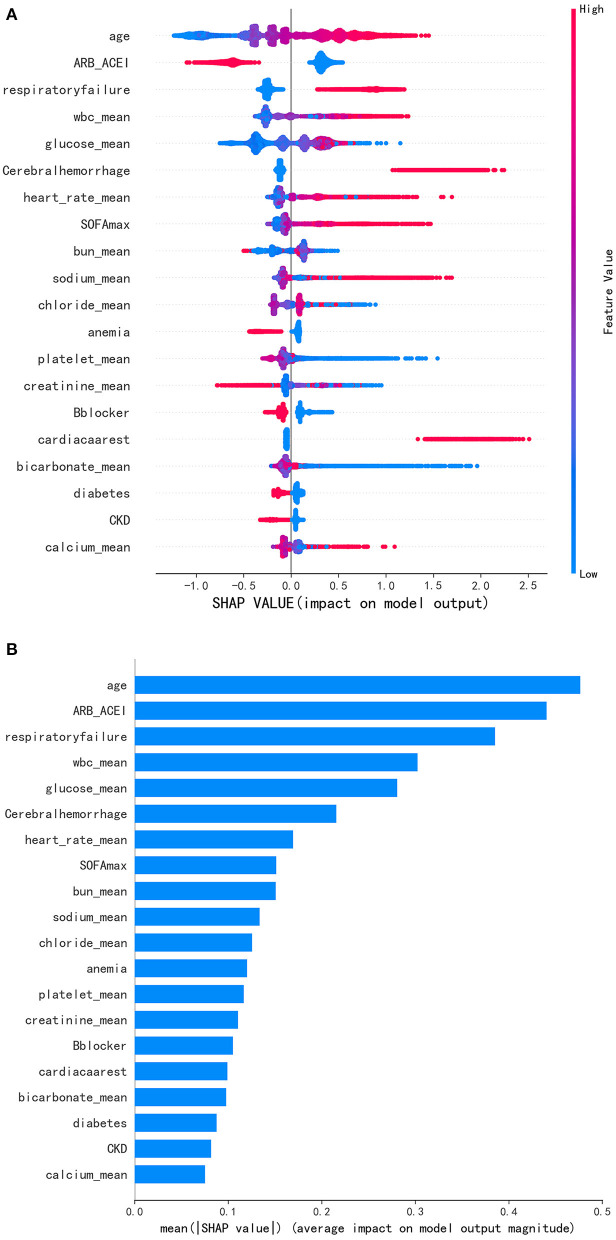
Figure 4.
(A) Distribution of the impact each feature had on the full model output using SHapley Additive exPlanations (SHAP) values. (B) Significance of the predictors in the LightGBM model. Features were ranked according to the sum of absolute SHAP values of all samples. Longer bars indicated greater feature importance. Blue represented the lower value and red represented higher value of a single sample. A positive SHAP value represented an increase in the risk of hospital mortality.

