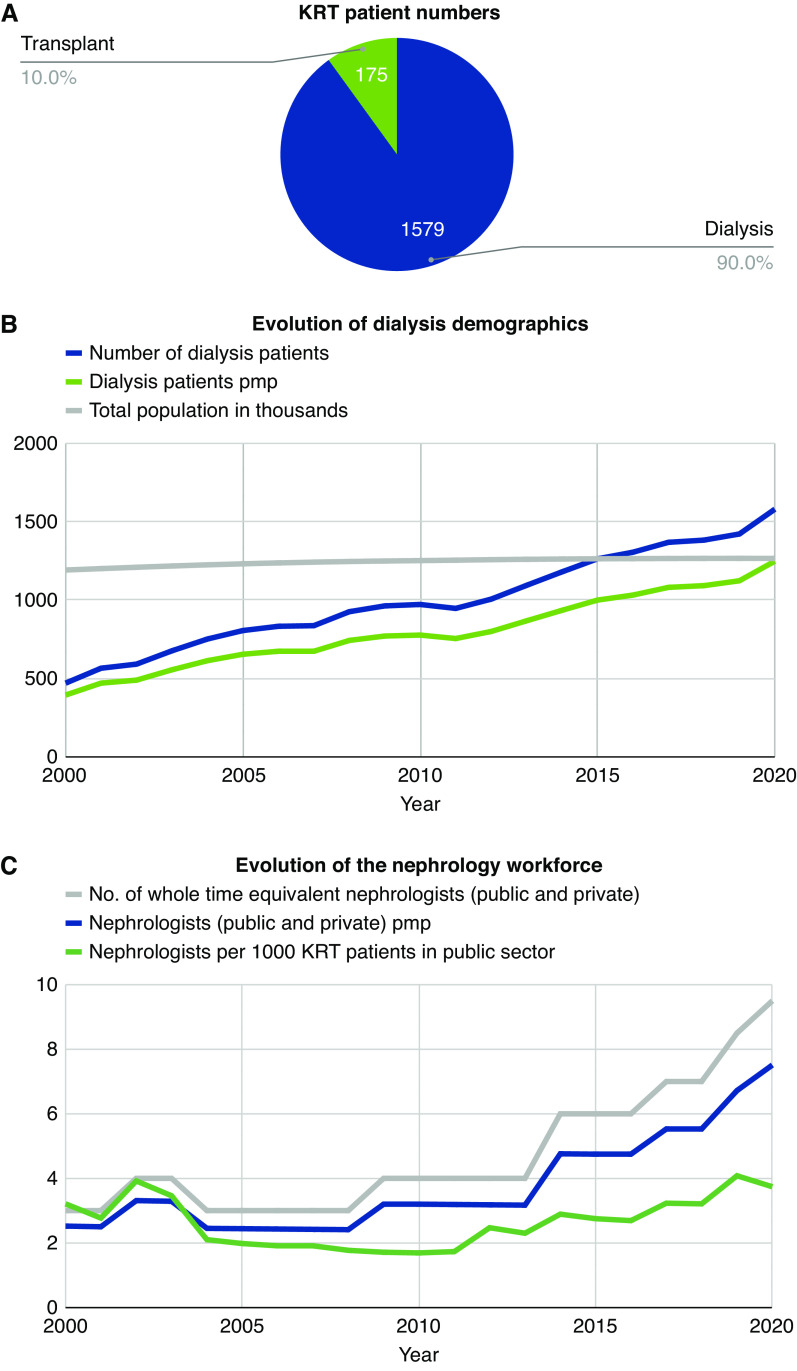
Figure 2.
RRT patient numbers, evolution of dialysis demographics and of the nephrology workforce in Mauritius. (A) Number of patients on kidney replacement therapy (KRT) on the 31st December 2020. (B) Evolution of dialysis demographics between 2000 and 2020 as measured by number of dialysis patients, dialysis patients per million population (pmp) and total Mauritius population in thousands. (C) Evolution of the nephrology workforce in Mauritius between 2000 and 2020 as measured by number of whole time equivalent nephrologists (public and private), number of nephrologists (public and private) pmp and nephrologists per 1000 KRT patients in public sector. Source: Ministry of Health and Wellness, Mauritius.

