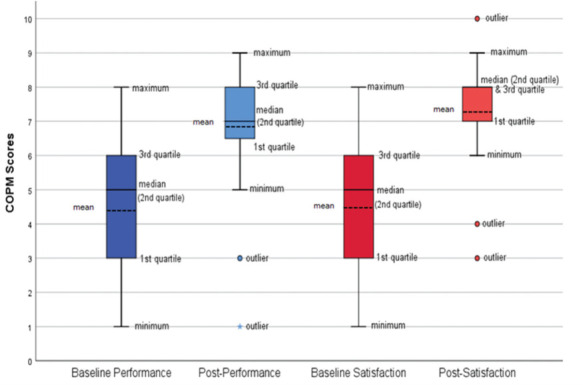
Figure 1.

Box and whisker plots showing distribution of performance (blue) and satisfaction (red) scores before and after coaching (n = 31 goals). Upper and lower margins of the box indicate interquartile range. Center solid line sits at median score. Outer bars (whiskers) represent range of scores at each end of distribution, with circles and asterisks indicating outliers. COPM = Canadian Occupational Performance Measure.
