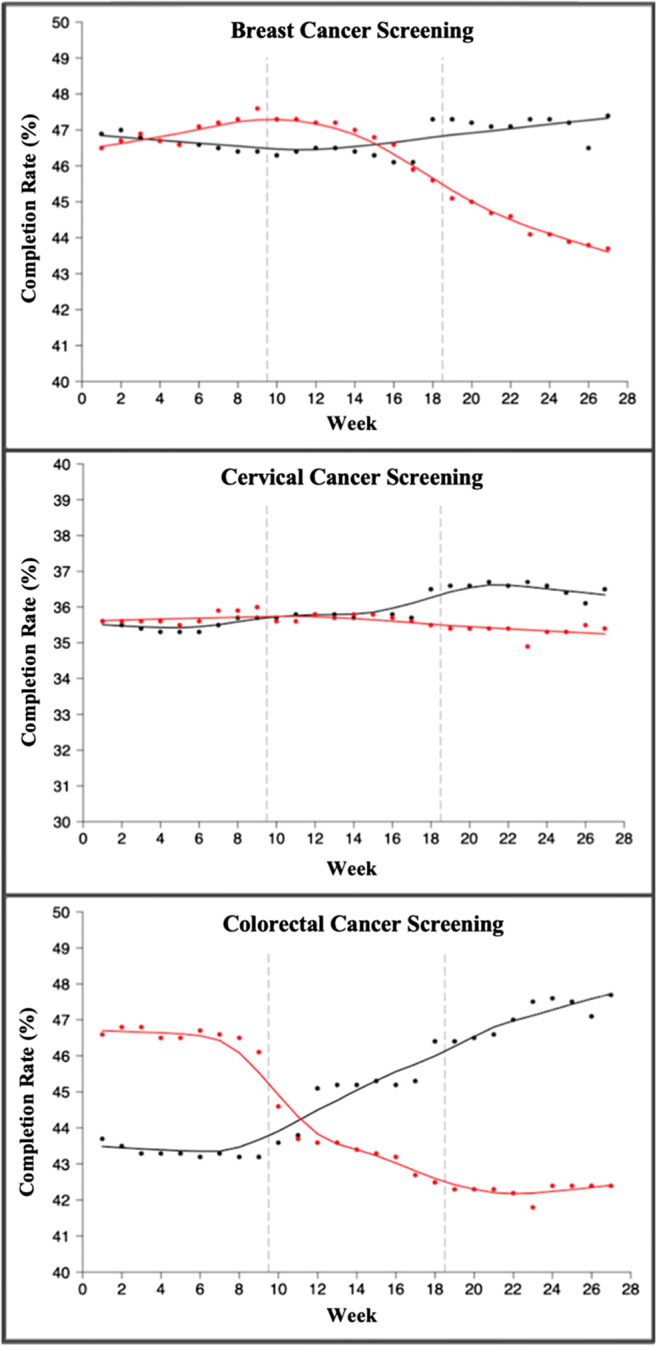
Fig. 1.

Trends in breast, cervical, and colorectal cancer screenings by week (weeks 1–27 in 2019 vs 2020). Black line: average weekly completion rate (%) for each screening in 2019. Red line: average weekly completion rate (%) for each screening in 2020. For each graph, dashed line at 9 weeks indicates start of stay-at-home order, and dashed line at 19 weeks indicates start of phased reopening during the COVID-19 pandemic.
