
Fig. 6.
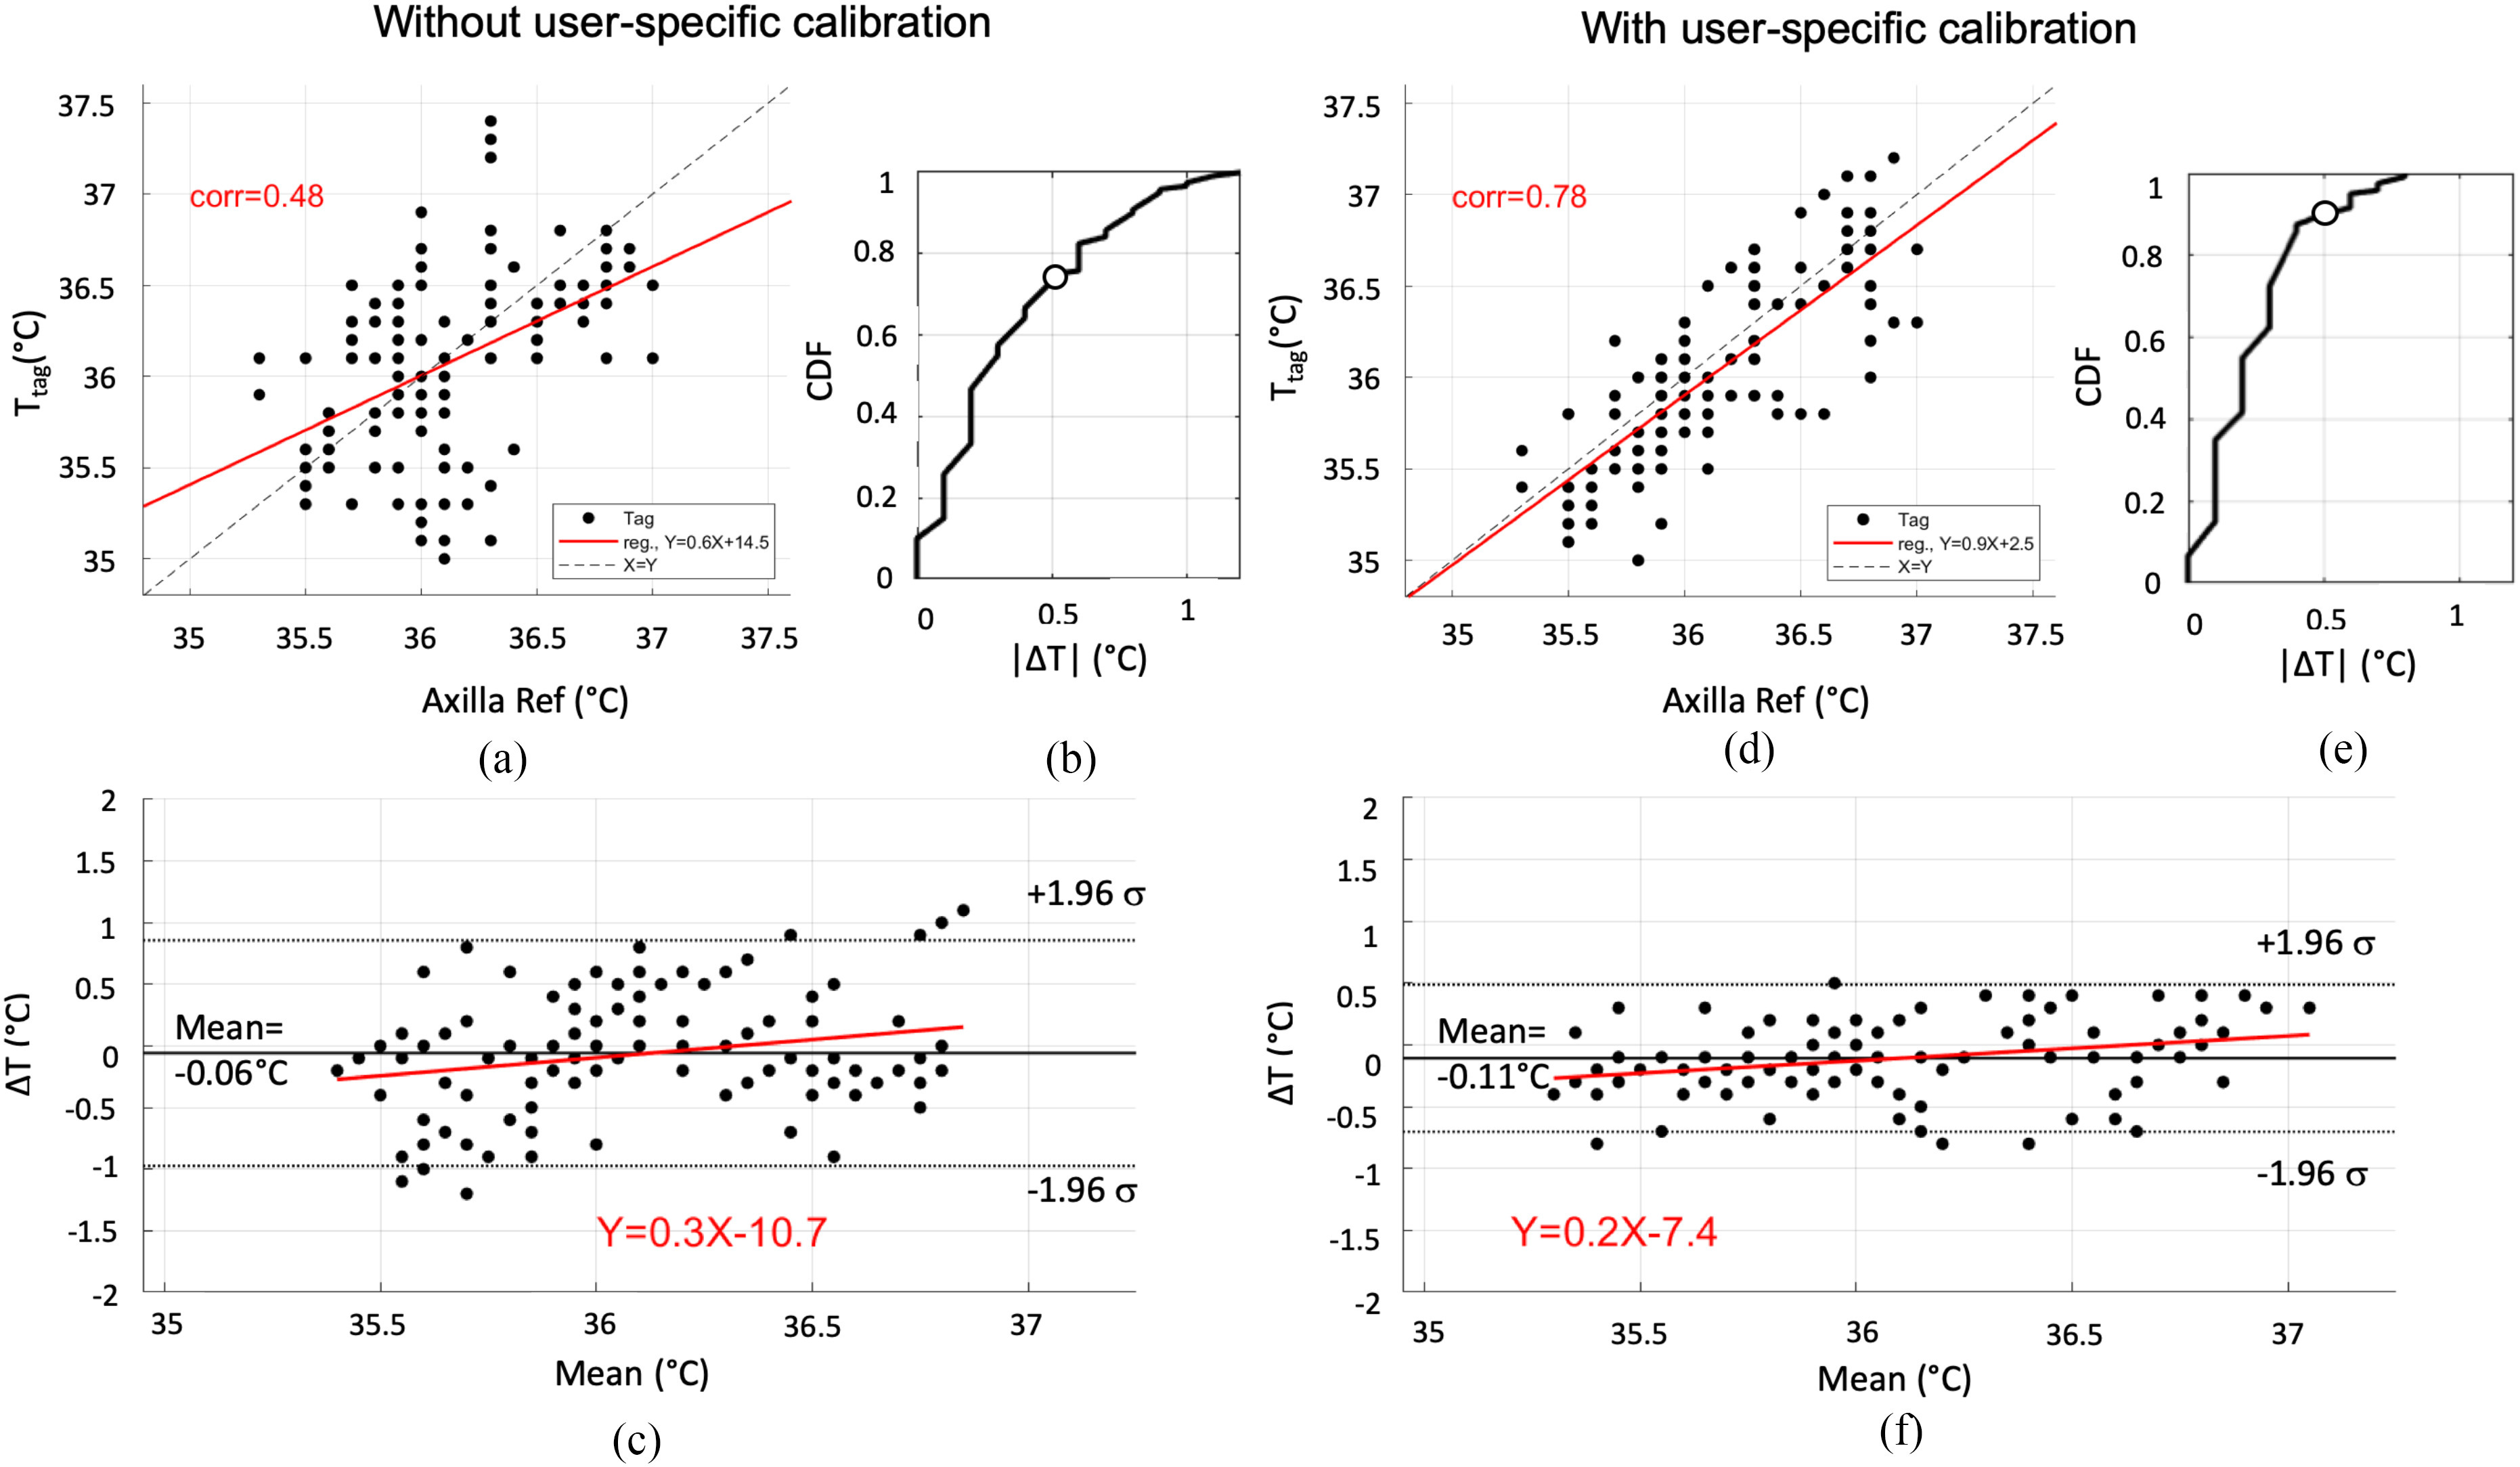
Numerical processing of degree of agreement between the two datasets  without and user-specific calibration. (a) and (d) RFID data versus reference thermometer. (b) and (e) Cumulative distribution of differences
  . (c) and (f) Bland–Altman diagrams with an indication of 95% limit of agreement, bias, and linear regression.