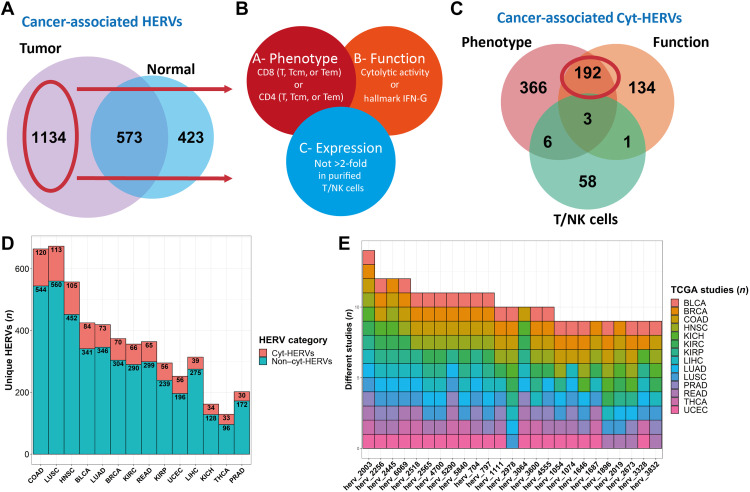
Fig. 1. Pancancer identification of HERVs associated with CTL responses.
(A) Venn diagram representing the total number of HERVs overexpressed in a tumor versus its normal counterpart (peritumoral tissue) and the total number of HERVs overexpressed in a normal peritumoral tissue versus its tumoral counterpart. HERVs overexpressed in at least one tumor and never overexpressed in any peritumoral tissue are considered cancer-associated. (B) Venn diagram of the selection criteria for an HERV to be annotated as associated with CTL response (cyt-HERV). Each HERV had to be associated with both a phenotype (CD8 or CD4 T cell signatures) and a function [cytolytic activity (granzyme B and perforin 1) or IFN-γ signature] criteria (A and B) and not overexpressed in normal purified T/NK cells (A and B not C). (C) Venn diagram of CAHs’ association with CTL responses criteria defined in (A). A total of 192 HERVs are annotated as cyt-HERVs. (D) Proportion of CAHs annotated as cyt-HERVs per cancer subtype. Cyt-HERVs are colored in red. (E) The top 25 most shared cyt-HERVs with their respective tumors. The number of different cancers is represented on the y axis.

