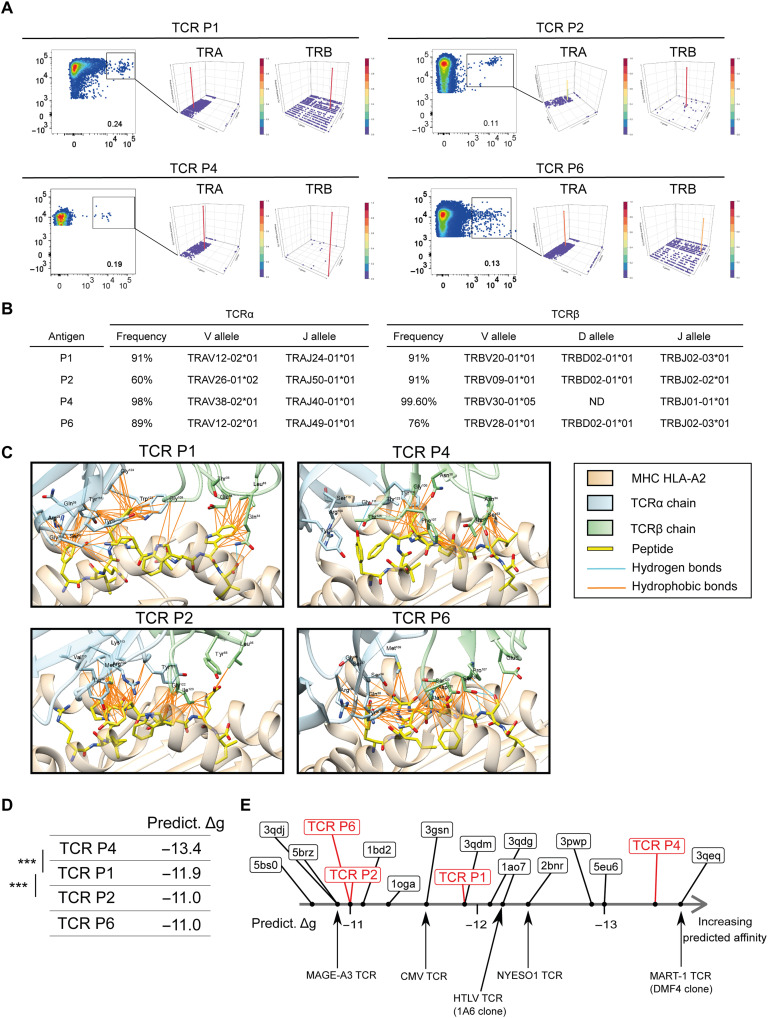
Fig. 5. Visualization of CDR loops and CDR loop interactions with peptides.
(A) Epitope-specific CD8+ T cells from HLA-A2–positive healthy donors (P1 from HD22, P2 and P4 from HD11, and P6 from HD23) sorted by fluorescence-activated cell sorting. Sorted cells (left in all four panels, gated) underwent TCR sequencing, and results are shown in Manhattan plot reports of the V/J recombination of the TCRα (center in all panels) and TCRβ (right in all panels). V and J segments are represented according to chromosomal location on the x and y axis, respectively. Productive frequencies of clones are represented on the z axis. (B) Productive frequency of the TCRα and TCRβ CDR3 sequences for the top clones specific to each peptide (P1, P2, P4, and P6) and the corresponding resolved V, D, and J alleles. ND, not determined. (C) 3D representative models of the TCR-pMHC interface for each identified TCR. The MHC chains (HLA-A2) are colored in beige, TCRα chains in light blue, TCRβ chains in light green, and peptides in yellow. Peptide and TCR residues involved in the TCR-pMHC interaction are shown as sticks, with O atoms in red, N atoms in dark blue, and S atoms in yellow. Hydrogen bonds are represented as cyan lines, salt bridge as red lines, and hydrophobic contacts as orange lines. (D) Predicted binding affinities (Predict. Δg) are expressed in kilocalories per mole. Average values are reported. Stars indicate significant statistical test (Welch two-sample t test) at the 5% level. (E) Diagram ranking of modeled HERV-specific TCR-pMHC and reference TCR-pMHC complexes available in the Protein Data Bank and obtained from crystallography data, according to their predicted binding affinity. CDR, complementarity-determining region; TRA, α chain of TCR; TRB, β chain of TCR.

