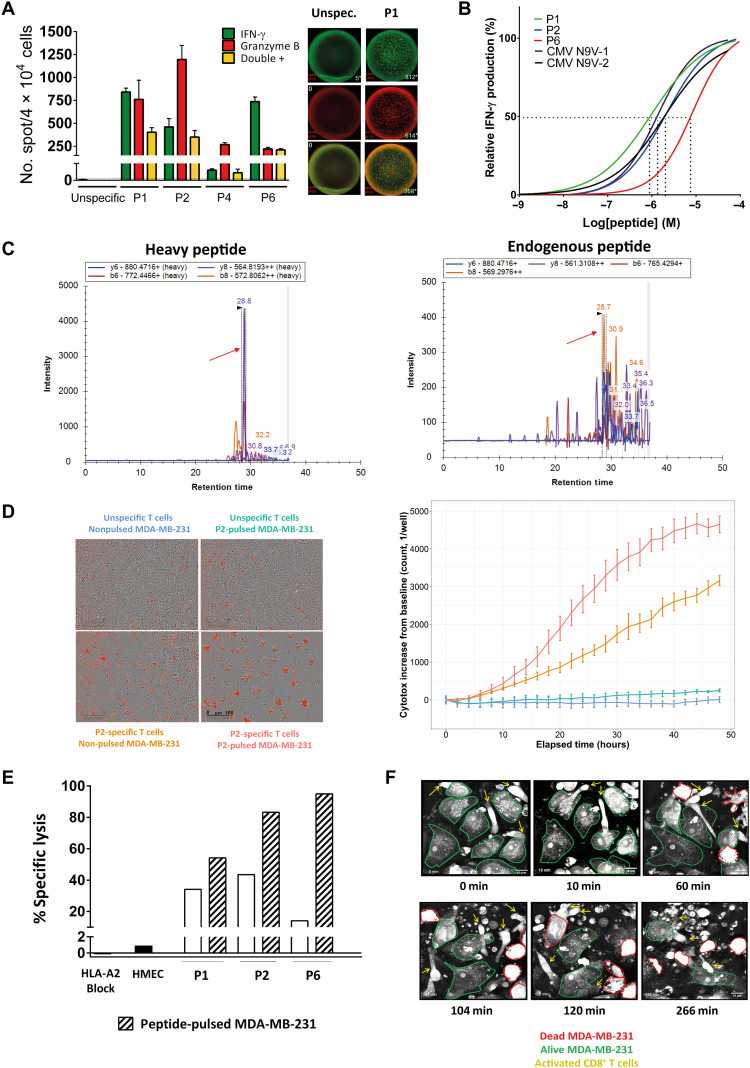
Fig. 6. HERV-specific T cell clones are functional and recognize and kill tumor cells.
(A) Left: Mean number and SD of IFN-γ, Grz-b, and double-positive spots counted on Fluorospot (duplicates). Right: Representative wells of IFN-γ (green), Grz-b (red), and double-positive (yellow) spots for unspecific (dextramer-negative, left) and peptide-specific (here P1) T cells (right) cocultured with T2 cells in a ratio of 10:1 for 24 hours. (B) Functional avidity of CD8+ T cell clones calculated as nonlinear fit of normalized IFN-γ production. N9-V1 and N9-2: CMV-specific T cell clones (see Materials and Methods). EC50 values are represented for each clone by the interpolation of the dashed lines with the x axis. (C) Valid-NEO transitions of peptide P1 (FLQFKTWWI) are shown on the chromatogram. Absolute quantification was performed as described in (62). (D) Left: Representative 10× images of cocultures of T cells (here, P2-specific) with MDA-MB-231 cell line (E:T = 2:1) in a 48-hour cell killing assay (IncuCyte). Dead MDA-MB-231 cells are depicted in red. Right: Cell death quantification represented as fluorescence intensity increase from the baseline (y axis) as function of the time (hours, x axis). The color code is the same as on the left. (E) Specific tumor cell lysis at 48 hours. Mean percentage of technical triplicates is plotted for each condition (data representative of at least two independent experiments). (F) Pictures (60×) of MDA-MB-231 cocultured with P1-specific CD8+ T cells (E:T = 10:1) at different time points (Nanolive). T cells are shown by yellow arrows.

