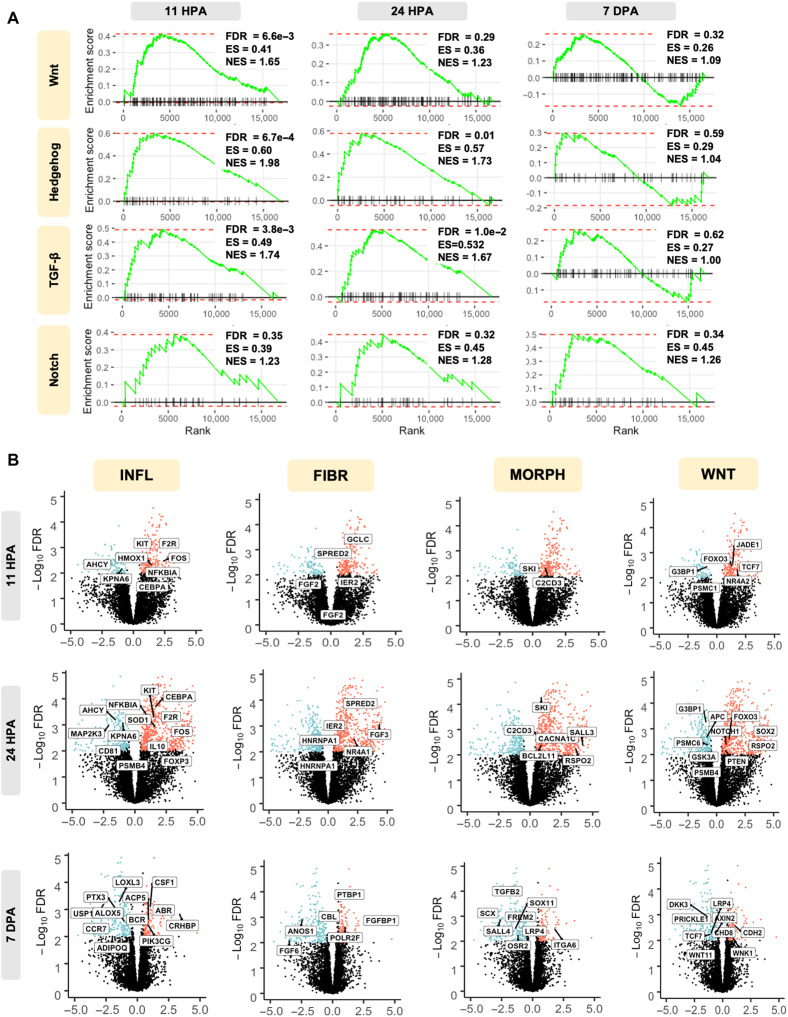
Fig. 4. Transcriptomic changes reflect regeneration-focused signaling mechanisms.
(A) GSEA enrichment plots displayed major signaling pathways involved in cell morphogenesis that were up-regulated in the early blastema in MDT-exposed animals relative to ND. Specifically, up-regulated genes enriched within each KEGG term are shown within each GSEA plot. FDR (adjusted P value), enrichment score (ES), and normalized ES (NES) are presented with each plot. Cell morphogenesis–related signaling peaks at 11 hours and decreases over time, with WNT, hedgehog, and TGF-β displaying no significant differences in differential gene expression between MDT and ND 7 dpa. (B) Volcano plots depict statistical significance (FDR; adjusted P value) versus magnitude of change (fold change) for rapid visual identification of genes. Data points, representing individual genes, highlight fold change values that are also statistically significant. Statistical significance is measured by −log10(FDR). The fold change was measured by logFC [cutoff at logFC (>0.05)]. Significant GO pathways comparing MDT and ND groups 11 hours, 24 hours, and 7 days comparing MDT versus ND are displayed. Biologically significant results include KIT and IL10 for inflammation (INFL), FGD for fibroblast (FIBR), which varies as a function of time, and SALL4 for appendage morphogenesis (MORPH), which is up-regulated and typically observed during scar-free wound healing in axolotls.

