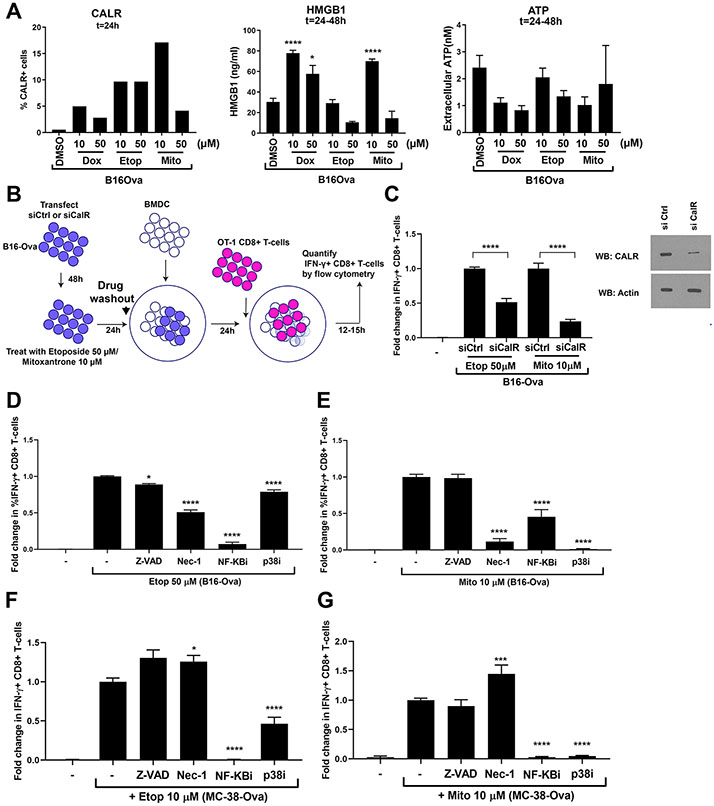
Figure 2: T-cell IFN-γ responses by DNA-damaged tumor cells involves calreticulin and signaling through NF-κB, p38 MAPK and RIPK1.
(A) Left, percentage of B16-Ova tumor cells displaying surface calreticulin 24 hours after the indicated treatment from a representative of two experiments. Results from an additional representative experiment using a second antibody is shown in fig. S2A. Middle and right, levels of HMGB1 and ATP in the culture media measured 24 to 48 hours after the indicated treatment. Results are from 4 independent experiments, with error bars indicating SEM. *P<0.05, **P<0.01, ***P<0.005, and ****P<0.0001 compared to DMSO-treated control by ANOVA followed by Dunnett’s multiple comparisons test. “ns” indicates P>0.05 by one-way ANOVA. (B) Schematic of the siRNA experiment testing the role of B16-Ova cell calreticulin in BMDC-mediated IFN-γ induction in T cells. (C) Left, quantification of the fold change in %IFN-γ+ CD8+ T-cells from the experiment in (B). Data for each calreticulin knockdown condition is normalized to the respective drug-treated control knockdown condition. Results represent 3 independent experiments with error bars indicating SEM. Data were analyzed by ANOVA followed by Sidak’s multiple comparisons test comparing drug-treated knockdown to drug-treated controls. * P<0.05 and **** P<0.0001. Right, quantification of calreticulin knockdown efficiency by Western blotting. First lane, “-”, defined as in Fig. 1C. (D to G) Quantification of the fold change in %IFN-γ+ CD8+ T cells induced by BMDC after incubation with etoposide- or mitoxantrone-treated B16-Ova (D and E) or MC-38-Ova (F and G) cells that were co-treated with the indicated DNA damaging agent plus either Z-VAD, necrostatin-1 (Nec-1), Bay 11-7085 (inhibitor of NF-κB signaling) or SB202190 (p38 MAPK inhibitor). First lane (−) defined as in Fig. 1C. Data are normalized to the condition in which B16-Ova cells are treated with etoposide alone or mitoxantrone alone, respectively. Results from 3 independent experiments with error bars indicating SEM. *P<0.05 and ****P<0.0001 wherein each co-treatment condition (etoposide or mitoxantrone + either Z-VAD, Nec-1, NF-κBi or p38i) is compared with the etoposide or mitoxantrone alone condition using ANOVA followed by Dunnett’s multiple comparisons test.

