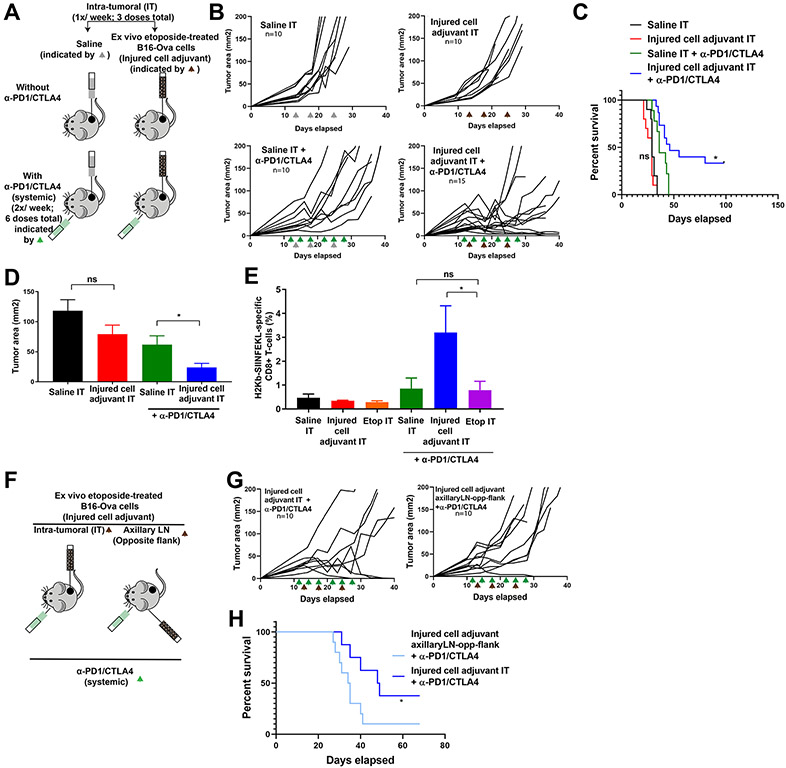
Figure 4: Intra-tumoral administration of ex vivo DNA-damaged tumor cells plus systemic ICB expands CD8+ T-cells and increases tumor control and survival.
(A) Schematic of the experimental design and dosing regimen used for testing intra-tumoral administration of etoposide-treated B16-Ova cells (injured cell adjuvant) in the presence or absence of systemic anti-PD1 and anti-CTLA4. (B) Tumor growth curves for mice treated with intra-tumoral saline (Saline IT; gray arrowheads) or ex vivo etoposide-treated B16-Ova cells (Injured cell adjuvant IT; brown arrowheads) in the presence or absence of systemic anti-PD1 and anti-CTLA4 (green arrowheads). “n” indicates the number of mice in each group. (C) Kaplan-Meier Survival curves of the experiment in (B). *P<0.05 by log-rank test compared to the Saline IT + anti-PD1/CTLA4 group. “ns”, P>0.05. (D) Average tumor cross-sectional area on day 21 for each treatment group. Error bars indicate SEM. *P<0.05 and “ns” P>0.05 by one-tailed t-tests. (E) Frequency of circulating H2-Kb/SIINFEKL -specific CD8+ T cells from mice after the indicated treatments. *P<0.05 and “ns” P>0.05 by ANOVA followed by Sidak’s multiple comparisons test. (F) Schematic of the experimental design and dosing regimen used for testing intra-tumoral administration versus contralateral flank administration (draining the axillary lymph node) of etoposide-treated B16-Ova cells (injured cell adjuvant) in combination with systemic anti-PD1 and anti-CTLA4. This was done independently of the cohorts used in (B, C, D and E). (G) Tumor growth curves for mice treated with intra-tumoral (IT) or distant lymph node (axillary LN, opposite flank) injection of ex vivo etoposide-treated B16-Ova cells (Injured cell adjuvant) in combination with systemic anti-PD1 and anti-CTLA4. “n” indicates the number of mice in each group. (H) Kaplan-Meier Survival curves of the experiment in (G). *P<0.05 by log-rank test.

