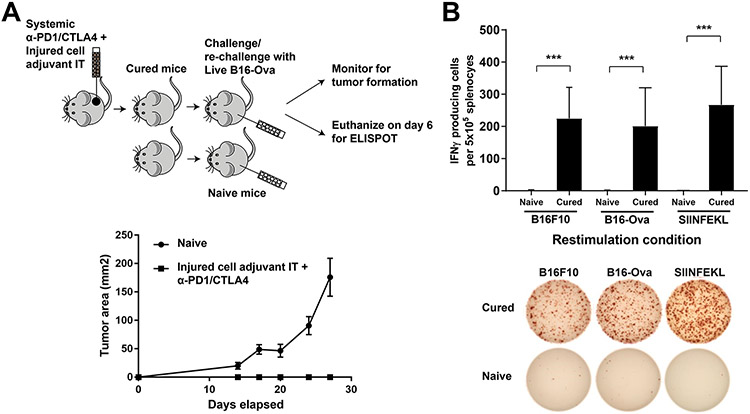
Figure 5: Long-term immunological memory and CD8+ T cell responses towards non-Ova antigens are induced by the injured cell adjuvant plus ICB.
(A) Top, schematic of the re-challenge experiment to monitor tumor growth, and a separate re-challenge experiment in an independent cohort for ELISPOT. To monitor tumor growth, 5 naïve mice and 5 mice that demonstrated complete tumor regression following treatment with injured cell adjuvant + systemic anti-PD1/CTLA4 were re-challenged in the opposite flank with 100,000 live B16-Ova cells. For ELISPOT, an independent cohort of mice that demonstrated complete tumor regression following treatment with injured cell adjuvant + systemic anti-PD1/CTLA4 were re-challenged with 100,000 live B16-Ova cells. On Day 6 after re-challenge, spleens were harvested and splenocytes were re-stimulated with either B16-F10, B16-Ova cells or with purified SIINFEKL peptide. Spleens from naïve mice were also re-stimulated as above. Bottom, resulting tumor growth curves from the re-challenge experiment (on 5 cured mice derived from three independent experiments) to monitor tumor growth. Error bars indicate SEM. (B) Top, quantification of ELISPOT results (from 5 cured mice derived from three independent experiments) expressed as IFN-γ–producing cells per 105 splenocytes. Error bars indicate SEM. ***P<0.005 by two-way ANOVA. Bottom, representative images from the ELISPOT plate for the conditions in the top panel.

