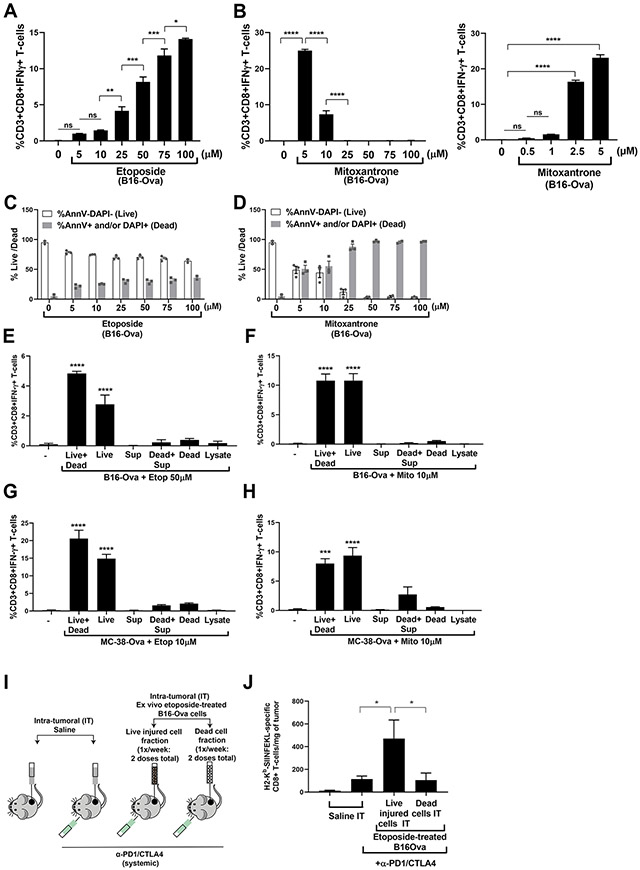
Figure 7: Live injured cells, rather than dead cells, are the primary determinants of DC-mediated T cell IFN-γ responses.
(A and B) Quantification from three independent experiments of IFN-γ+ CD8+ T-cells induced by co-culture of BMDC with B16-Ova cells treated with etoposide (A) or mitoxantrone (B) at the indicated concentrations for 24 hours. The first lane (−) indicates the percentage of IFN-γ+ CD8+ T cells produced by co-culture of BMDCs and T-cells in the absence of B16-Ova cells. Error bars indicate SEM. *P<0.05, **P<0.01, ***P<0.005, ****P<0.0001, and “ns” P>0.05 by ANOVA followed by Sidak’s (A and B, left) or Dunnett’s (B, right) multiple comparisons test. (C and D) Quantification from two to three independent experiments of the proportion of live (AnnV and DAPI double negative; white bars) and dead (sum total of AnnV and/or DAPI single or double positive; grey bars) cells after treatment of B16-Ova cells for 24 hours with etoposide or mitoxantrone as indicated. Data points are shown with means ± SEM; where N=2, error bars indicate range. (E and F) Quantification from three independent experiments of IFN-γ+ CD8+ T cells induced by co-culture of BMDC with the indicated B16-Ova (E and F) or MC-38-Ova (G and H) live cell (AnnV−/DAPI−) and dead cell fractions obtained after treatment with etoposide (50 μM) or mitoxantrone (10 μM). “-”, controls. BMDC was co-cultured with each of the fractions or combinations thereof for 24 hours before OT-1 CD8+ T cells were added. Live+dead, whole treated cell mixture; Live, live cell fraction; Dead, dead cell fraction; Sup, cell-free supernatant; Dead+Sup, dead cells combined with cell-free supernatant. Error bars indicate SEM. ***P<0.005, and ****P<0.0001 by ANOVA followed by Dunnett’s multiple comparisons test. (I) Schematic of the experimental design and dosing regimen used to test the effect of intra-tumoral administration of etoposide-treated B16-Ova cells in combination with systemic anti-PD1/CTLA4 on the frequency of intra-tumoral H2-Kb/SIINFEKL–specific CD8+ T-cells. Dosing frequency of saline, live or dead fractions of ex vivo etoposide-treated B16-Ova cells (IT) and systemic anti-PD1 and anti-CTLA4 was as shown in Fig. 6A. Tumors were harvested 2 days after the second dose of injured cell adjuvant. (J) Frequency of intra-tumoral H2-Kb/SIINFEKL–specific CD8+ T cells from tumors treated with the conditions indicated (four to five mice per group). Error bars represent SEM. *P<0.05 by ANOVA followed by Sidak’s multiple comparisons test.

