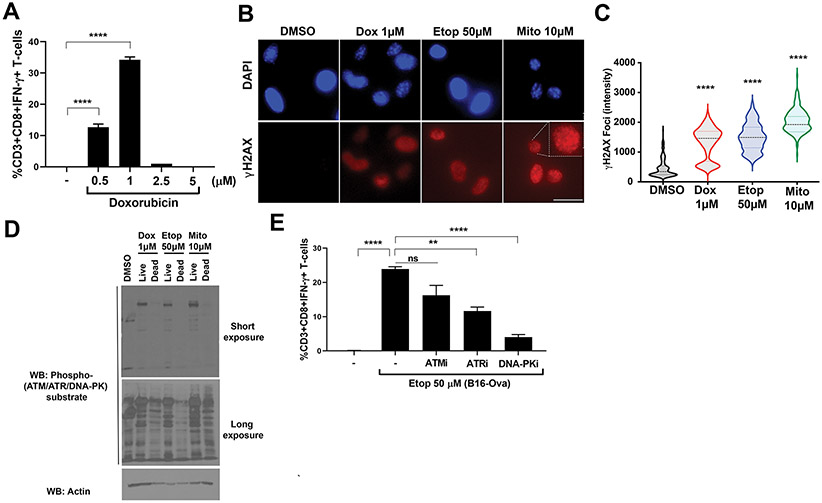
Figure 8: Live injured chemotherapy-treated tumor cells require DNA-damage signaling for the DC-mediated T cell IFN-γ response.
(A) B16-Ova cells were treated with doxorubicin at 0.5, 1, 2.5 or 5 μM for 24 hours, washed, and incubated with primary bone marrow-derived dendritic cells (BMDC) for another 24 hours. Following this, OT-I CD8+ T cells were added and evaluated for intracellular IFN-γ 15 hours later. Quantification of IFN-γ+ CD8+ T-cells from three independent experiments is shown. Error bars represent SEM. ****P<0.0001 by ANOVA followed by Dunnett’s multiple comparisons test. (B) B16-Ova cells were treated with doxorubicin, etoposide, or mitoxantrone at the doses indicated for 24 hours and the live (attached) fractions were analyzed by fluorescence microscopy after staining with DAPI (blue channel) and anti-γH2AX (red channel). Representative images are shown. Scale bar, 20 μm. (C) Quantification of γH2AX foci intensity from the experiment in (B) is shown. n ≥ 200 cells per condition. Width in violin plot indicates frequency for each observed value from maximum to minimum, with dotted line indicating median. ****P<0.0001 by ANOVA followed by Dunnett’s multiple comparisons test compared to the DMSO control. (D) B16-Ova cells were treated with doxorubicin, etoposide, or mitoxantrone at the doses indicated for 24 hours followed by separation of the live and dead fractions and analysis of respective lysates by Western blotting. Blots are representative of two independent experiments. (E) Quantification of IFN-γ+ CD8+ T cells (from three independent experiments) induced by BMDC following incubation with B16-Ova cells that were co-treated with 50 μM etoposide and 10 μM of either ATM kinase inhibitor KU-55933, ATR kinase inhibitor AZD6738 or DNA-PK inhibitor NU7441. First lane (−) defined as in Fig. 1C. Error bars represent SEM. **P<0.01 and ****P<0.0001 by ANOVA followed by Dunnett’s multiple comparisons test versus the “Etop 50 μM” group.

