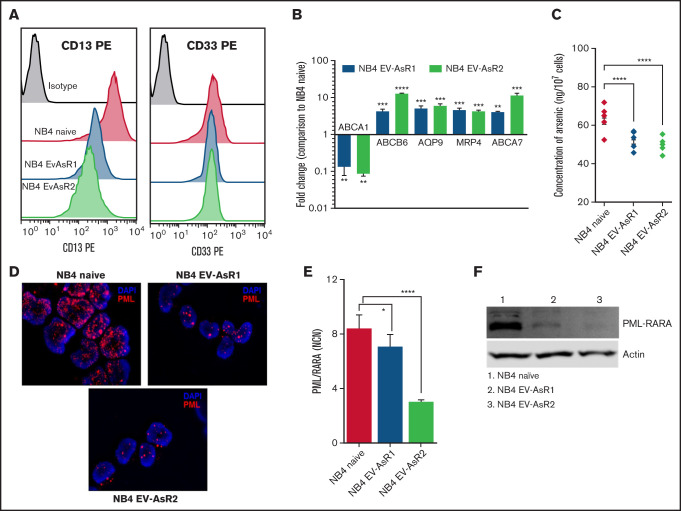
Figure 2.
Heterogeneity in the cell surface marker and transporters expression of the ATO-resistant cell line compared with parental cell line. (A) CD13 and CD33 surface expression of ATO-resistant cell lines compared with the NB4 naïve cell line. (B) Relative messenger RNA (mRNA) levels of the ATO influx gene (ABCA1) and efflux transporters genes (ABCA7, AQP9, MRP4, and ABCB6) in the in-house–generated ATO-resistant cell lines compared with the NB4 naïve cell line which is normalized to 1. (C) Intracellular ATO levels in NB4 naïve and ATO-resistant cell lines after 24 hours of treatment with 0.5 µM ATO. (D) Fluorescent microscopic images of PML (red) in NB4 naïve and ATO-resistant cell lines that show nuclear body formation and micro speckled pattern (oil immersion lens; original magnification ×63). (E) Normalized copy number (NCN) of PML-RARA transcripts in the NB4 naïve and in-house–generated ATO-resistant cell lines. (F) Immunoblots of the PML-RARA fusion protein levels in NB4 naïve and ATO-resistant cell lines. All error bars represent the mean ± standard error of the mean (SEM) of 3 independent experiments. *P ≤ .05; **P ≤ .01; ***P ≤ .001; ***P ≤ .0001. DAPI, 4′,6-diamidino-2-phenylindole; PE, phycoerythrin.

