Figure 4.
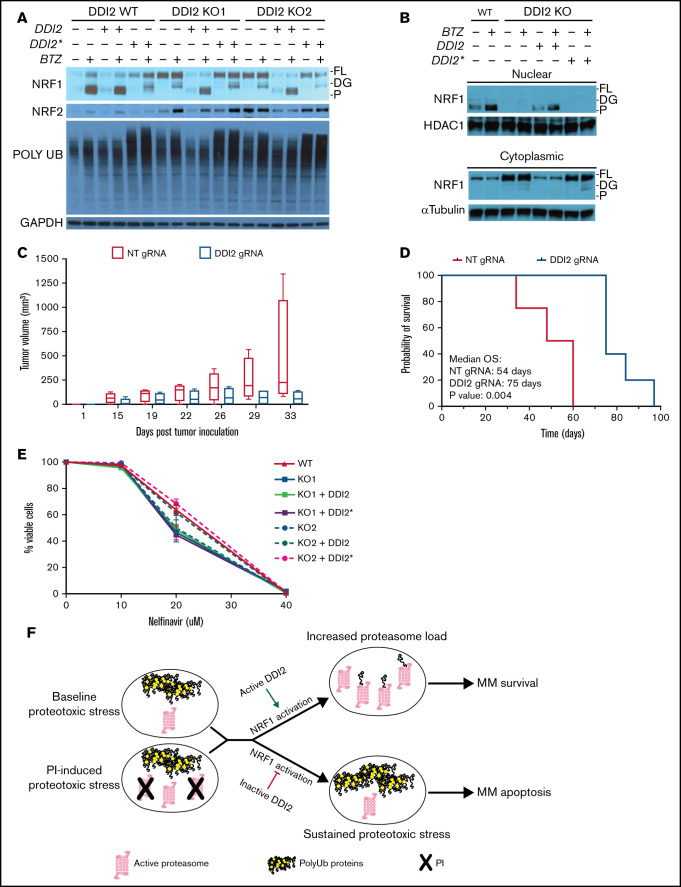
DDI2 KO blocks NRF1 processing and nuclear translocation and WT DDI2 but not catalytically-dead DDI2* rescues NRF1 processing. (A) Western blot showing NRF1, NRF2, and polyUb proteins at baseline and upon bortezomib (BTZ) treatment in DDI2 WT and 2 distinct DDI2-KO clones transduced with an empty vector or vector expressing DDI2 or DDI2*. GAPDH served as loading control. FL, full length; DG, deglycosylated; P, processed form. (B) Western blot showing NRF1 in nuclear (upper blot) and cytoplasmic (lower blot) fraction of cell lysates from DDI2 WT cells or aDDI2-KO clone, with or without WT (DDI2) or catalytic-dead (DDI2*) DDI2 add-back, at baseline and upon BTZ treatment. FL, full length; DG, deglycosylated; P, processed form. (C) Five NSG mice per cohort were inoculated with AMO1 cells that had undergone gene editing with a nontargeting (NT) gRNA (red boxes) or a DDI2-targeting gRNA (blue boxes). Tumor growth was assessed by caliper measurement at the indicated times. Box and whisker plots show median and first and third quartile of tumor volume across the animals in each cohort, as measured on the indicated day post-tumor inoculation. (D) Kaplan-Meier curves of overall survival (OS) for mice harboring DDI2 WT (red line) or DDI2-KO (blue line) tumors. The median OS was 54 days vs 75 days respectively; P = .004. (E) Viability of DDI2 WT AMO1-VR cells and 2 distinct DDI2-KO AMO1-VR clones, with or without WT or catalytic dead DDI2 add-back, upon treatment with the protease inhibitor nelfinavir for 24 hours. Average of 3 independent experiments is shown. (F) Schema showing the rationale for targeting DDI2 in MM to exacerbate proteotoxic stress in baseline conditions and/or upon PI treatment.

