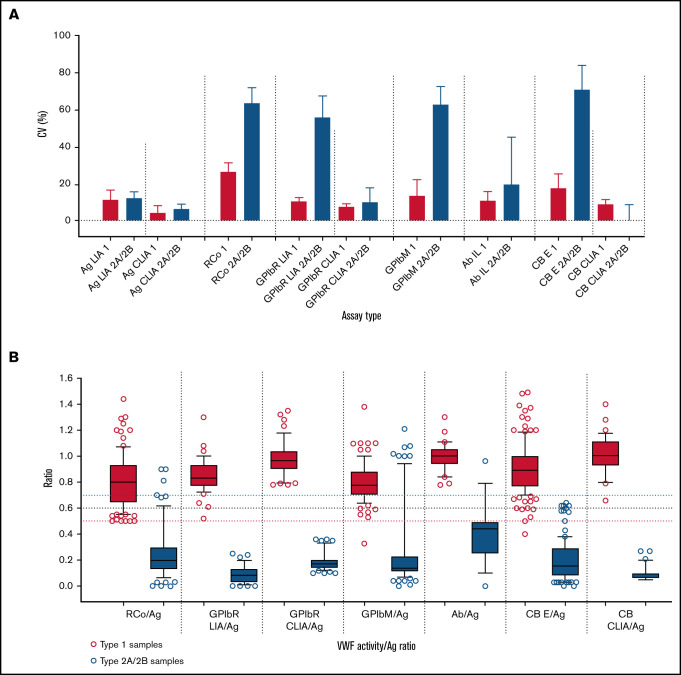
Figure 1.
Summary data from the Royal College of Pathologists Quality Assurance Program (RCPAQAP) for the years 2014 to 2021 inclusive. (A) Summary data for VWF assay variability. Data shown as median and interquartile range of the coefficient of variation (CV; %) on the y-axis. Assay is type listed along the x-axis in the following order: (1) VWF:Ag as LIA- and CLIA-based assays; (2) VWF:RCo; (3) VWF:GPIbR by LIA and CLIA; (4) VWF:GPIbM (LIA only); (5) VWF:Ab; and (6) VWF:CB by enzyme-linked immunosorbent assay (ELISA) and CLIA. Data compare type 1 plasma (n = 7; red) vs type 2A plasma (n = 5)/type 2B plasma (n = 5) as composite (blue) and as sent to participants over the period of analysis. There are fewer data points for CLIAs, because this method emerged in 2016; however, this method showed the overall least variability. Note that higher CVs are expected for functional VWF tests in type 2 VWD as test values approach 0. (B) Summary data for VWF activity/Ag ratios. Data respectively shown as box plots of ratios (y-axis) of VWF:RCo/VWF:Ag, VWF:GPIbR/VWF:Ag (LIA then CLIA based), VWF:GPIbM/VWF:Ag, VWF:Ab/VWF:Ag, and VWF:CB/VWF:Ag (ELISA then CLIA based) (x-axis) for data using type 1 plasma (n = 7; red) and type 2A/2B VWD patient plasma (n = 5; blue), as tested by RCPAQAP participants over the period of 2014 to 2021. Box plots show median and 10th to 90th percentile, with outliers shown as dots. Long horizontal dashed lines indicate 0.5 (red), 0.6 (black), and 0.7 (blue) cutoff values. Note that a cutoff of 0.7 is more inclusive and, for some assays, ensures greater capture of type 2 VWD cases; however, this comes at the cost of specificity, because the higher cutoff also inappropriately captures more cases of type 1 VWD.

