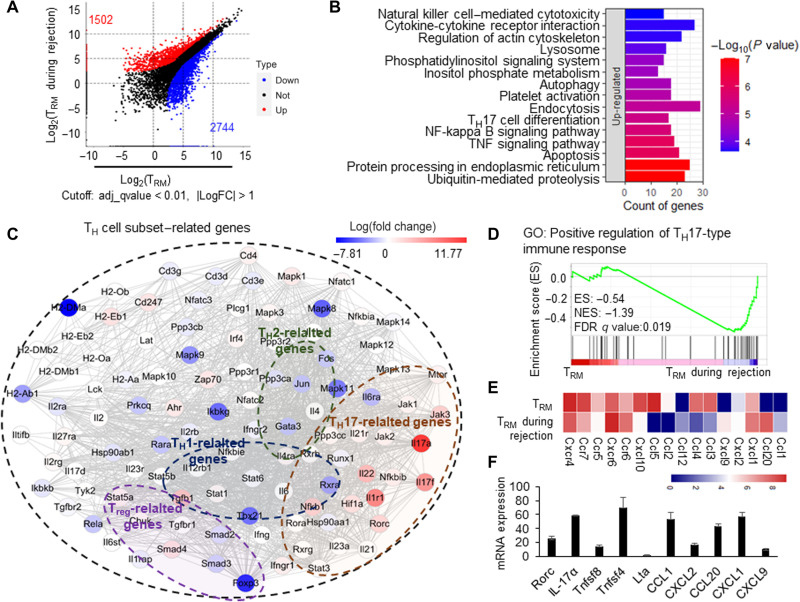
Fig. 6. CD4+ TRM cells in skin acquired a TH17-like transcriptional profile during the secondary immune response.
(A) Dot plot of induced CD4+ TRM cells and CD4+ TRM cells during rejection showing the differentially expressed genes. The red and blue colors represent the up- and down-regulated genes in CD4+ TRM during rejection, respectively. (B) Top 15 up-regulated pathways by differentially expressed genes of CD4+ TRM during rejection. KEGG database was used to map the signaling pathways. (C) Network summary of TH cell subset–related genes in CD4+ TRM during rejection; the color represents the log(fold change) of differentially expressed genes. (D) The GSEA enrichment of positive regulation of TH17-type immune response in CD4+ TRM during rejection. GO, gene ontology. (E) The heatmap of differentially expressed chemokines and chemokine receptors. (F) Relative expression of RORc, IL-17a, Tnfsf8, Tnfsf4, Lta, CCL1, CXCL2, CCL20, CXCL1, and CXCL9 in CD4+ TRM during rejection. The gene expressions in CD4+ TRM in skin tissues were used as control 1. Data are representative of three independent experiments (n ≥ 3). Data are means ± SD.

