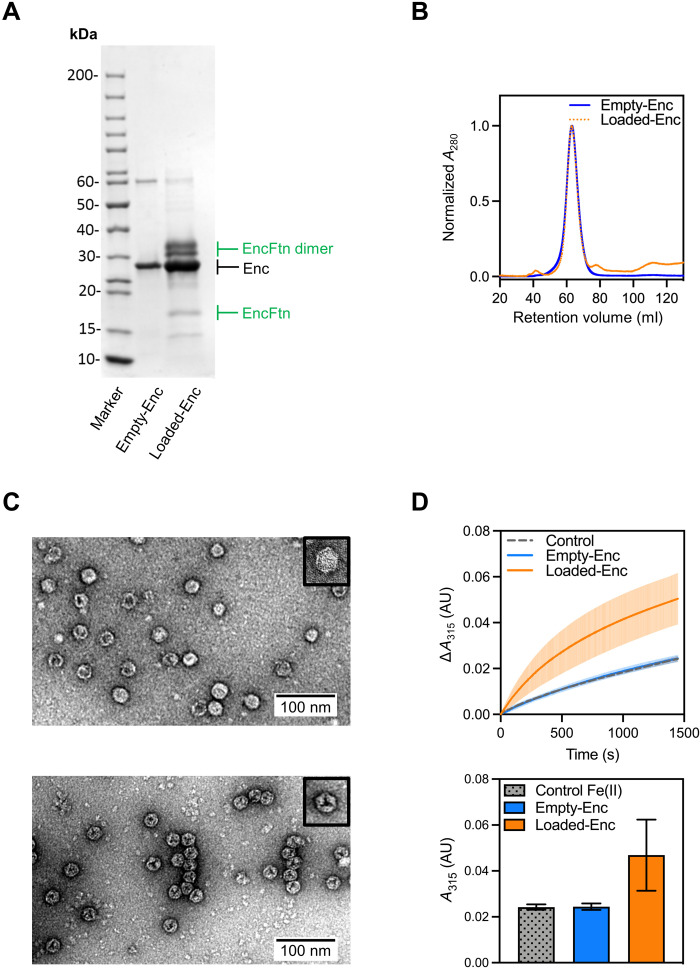
Fig. 1. Validation of the assembly and activity of Loaded-Enc and Empty-Enc nanocompartments.
(A) SDS–polyacrylamide gel electrophoresis (PAGE) of purified Empty-Enc and Loaded-Enc. Proteins are resolved by 15% acrylamide SDS-PAGE and stained with Coomassie blue stain. Encapsulin bands are near the 30-kDa marker and are highlighted by a black arrow. The EncFtn cargo of Loaded-Enc appears as both a monomer and a dimer. Bands corresponding to the monomer and dimer of EncFtn are highlighted with green arrows. (B) Recombinant, purified Empty-Enc (blue trace) and Loaded-Enc (orange, dotted trace) were analyzed by SEC using a Sephacryl 400 column (Cytiva). Both encapsulins elute at the same volume, suggesting that the encapsulin complexes are the same size regardless of cargo loading. (C) Negative-stain transmission micrographs of Empty-Enc (upper micrograph) and Loaded-Enc (lower micrograph) displaying individual particles for each complex. One nanocompartment of Empty-Enc and Loaded-Enc is shown in the upper right corner of each micrograph, with a hexagonal 2D geometry observed. (D) Top: Ferroxidase activity of Loaded-Enc compared to Empty-Enc. Protein samples were mixed with 100 μM FeSO4.7H2O. Following an incubation period at room temperature of 50 s, absorbance at 315 nm was measured over a time course of 1450 s. Control reference established using enzyme-free reaction as a measure of background iron oxidation. The lines represent the mean of all repeats; error bars represent the SD from the mean. Bottom: End point ferroxidase assay comparison. Ferroxidase activity shown by the total increase in A315 (absorbance at 315 nm) at the end point of the assay. Bars represent the mean of all repeats; error bars represent the SD from the mean. AU, Absorbance Units.

