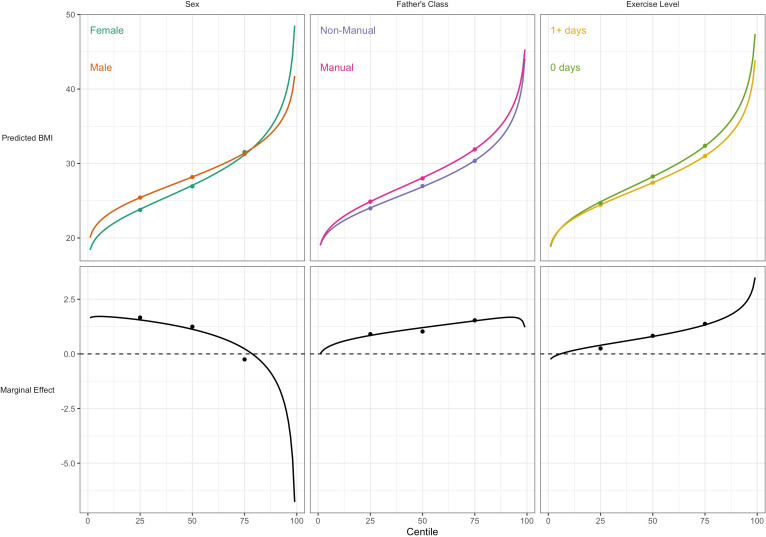
Figure 3. Association between risk factors and BMI by BMI centile.
Plotted lines are calculated using GAMLSS estimation results of the entire outcome distribution; points at the 25th, 50th, and 75th centiles are estimated using quantile regression models. Marginal effects show the differences in outcome between each risk group across the outcome distribution.

