. 2022 Jan 20;11:e72588. doi: 10.7554/eLife.72588

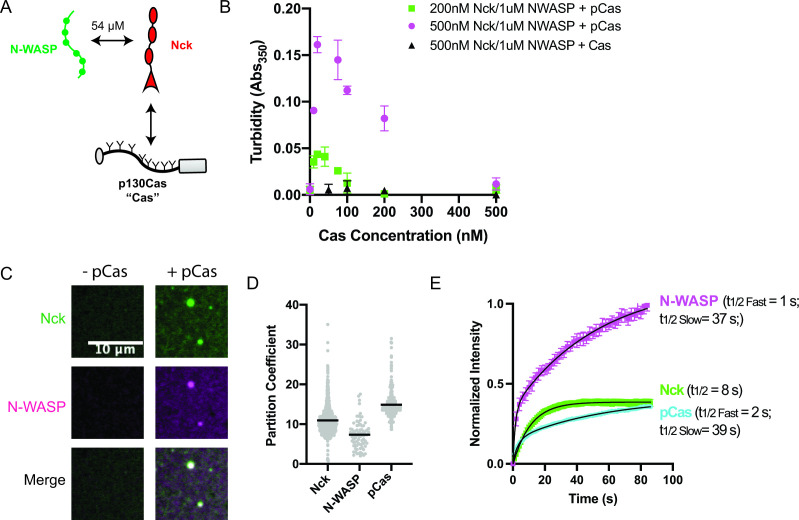
Figure 1. p130Cas, Nck, and N-WASP undergo liquid-liquid phase separation.

(A) Molecular interactions of IAC proteins, KD values indicated where known. Details and references in Supplementary file 1. (B) Solution turbidity measurements. Nck (200 nM, green; or 500 nM, magenta+ black) and N-WASP (1 µM) were combined with increasing concentrations of phosphorylated Cas (pCas, green+ magenta) or unphosphorylated Cas (Cas, black). Each point represents the mean ± SEM of three independent measurements. (C) Spinning disk confocal fluorescence microscopy images of droplets. Nck (1 μM, 15% Alexa568 labeled) and N-WASP (1 μM, 15% Alexa647 labeled) were combined ± pCas (1 μM, unlabeled). (D) Quantification of constituent partitioning into droplets. Each grey point represents an individual measurement, and the mean indicated by black line. Each condition contains at least 75 measurements from two or more independent experiments. (E) Fluorescence Recovery After Photobleaching (FRAP) measurements of droplets. Droplets formed from 1 μM each of Nck (15% Alexa568 labeled), N-WASP (15% Alexa647 labeled) and pCas (5%–647 labeled). Each point represents the mean ± SEM of at least six independent measurements. Recovery curves were fit with a single exponential (Nck) or biexponential (pCas, N-WASP) model and the fits are overlayed on the graph (black line). Detailed fit information in Supplementary file 4. All scale bars = 10 μm.

Figure 1.

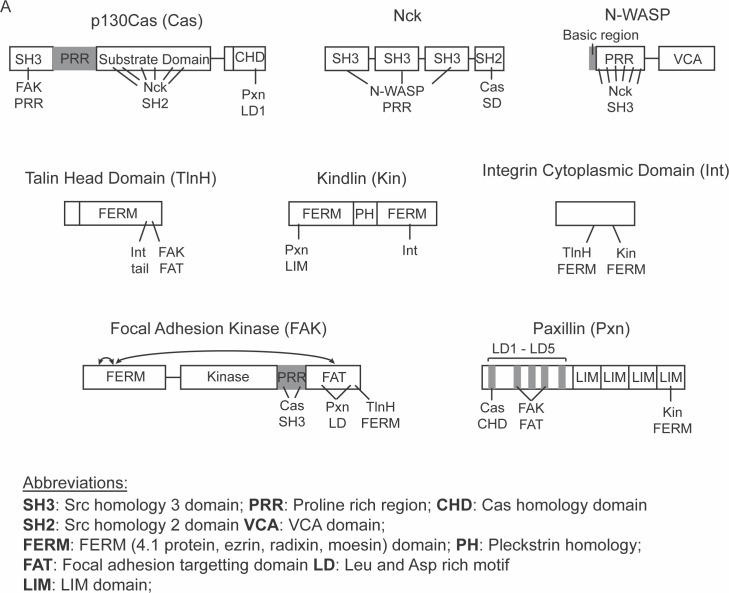
Figure 1—figure supplement 1. Domain organization of proteins used in this study.

Figure 1—figure supplement 1.

Relevant protein interactions are indicated with lines, number of lines corresponds to number of identified binding sites.
Figure 1—figure supplement 2. Purification of recombinant integrin adhesion complex proteins.

Figure 1—figure supplement 2.

0.5 μ g of purified protein was run on SDS-PAGE gels and stained with Coomassie Blue. Proteins include unphosphorylated p130Cas (Cas), phosphorylated p130Cas (P-Cas), Talin Head Domain (TlnH), Kindlin (Kin), FAK, Paxillin (Pxn), the cytsoplasmic tail of β1 Integrin (Int), Nck, and N-WASP.
Figure 1—figure supplement 2—source data 1. Uncropped gel images and unprocessed.tif files from Figure 1—figure supplement 2.
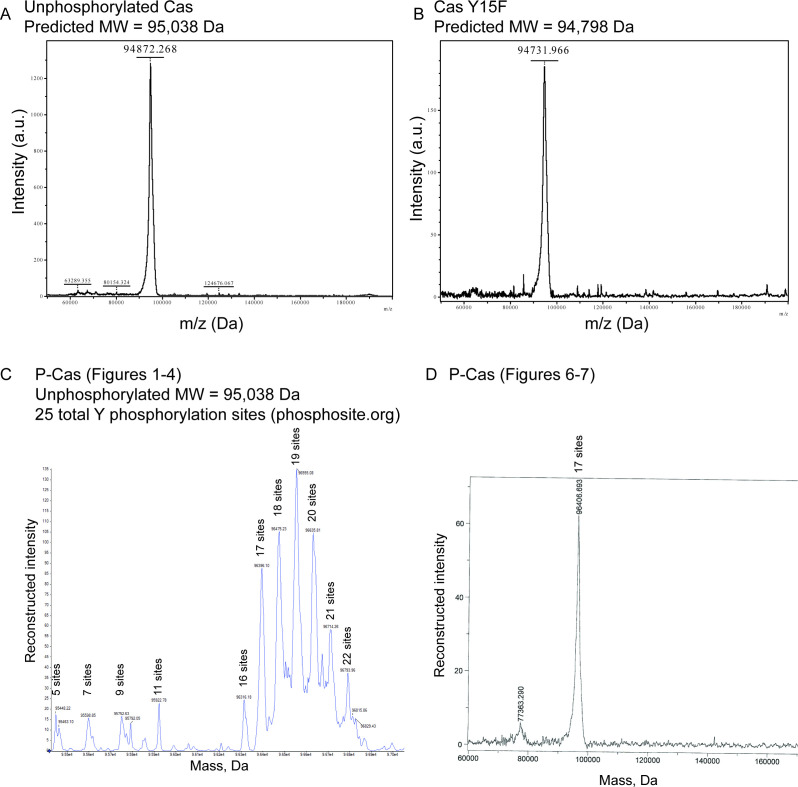
Figure 1—figure supplement 3. Intact mass spectrometry of p130Cas proteins.

Figure 1—figure supplement 3.

(A) Unphosphorylated wildtype p130Cas (B) Unphosphorylated p130Cas Y15F (C) Phosphorylated p130Cas (P-Cas) preparation used in Figures 15. (D) Phosphorylated p130Cas (P-Cas) preparation used in Figures 67. The estimated number of phosphorylation sites of each peak is indicated, assuming 79.98 Da per phosphorylation.
Figure 1—figure supplement 4. Droplets form with physiological protein concentrations.
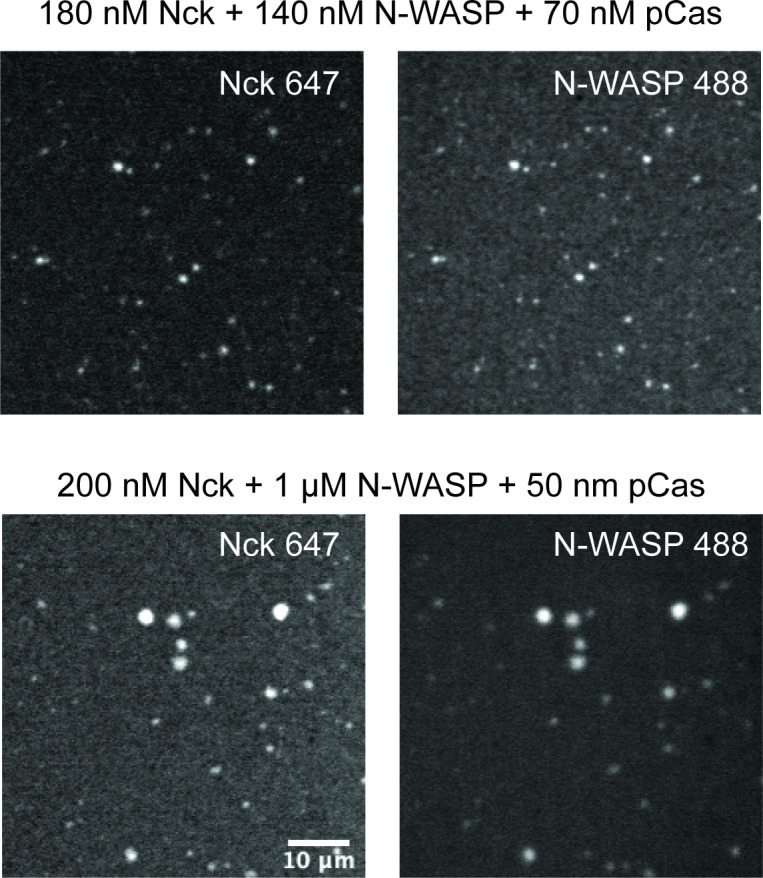
Figure 1—figure supplement 4.

Spinning disk fluorescence microscopy images of droplets. Top: 180 nM Nck (15% Alexa647), 140 nM N-WASP (15% Alexa488), and 70 nM phosphorylated p130Cas (pCas). Bottom: 200 nM Nck (15% Alexa647), 1 μ M N-WASP (15% Alexa488), and 50 nM pCas. Scale bar = 10 μ m.
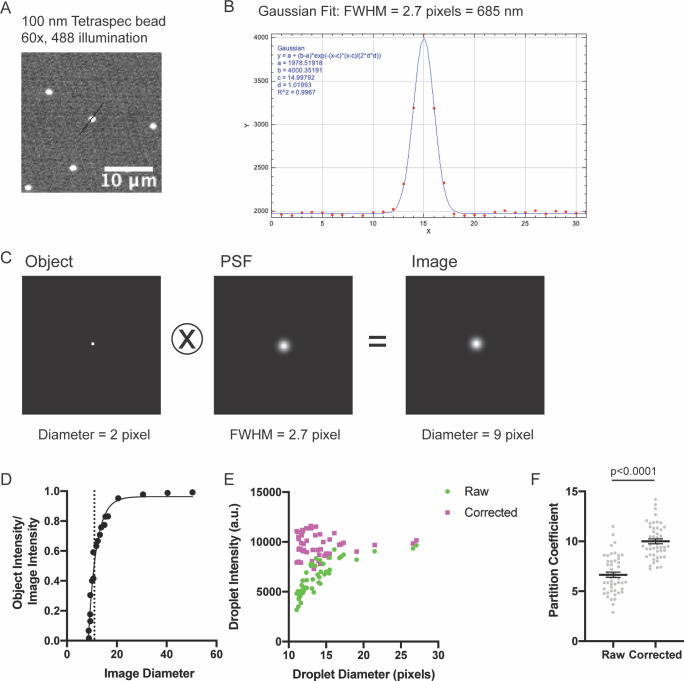
Figure 1—figure supplement 5. Measuring the point spread function (PSF).

Figure 1—figure supplement 5.

(A) Spinning disk fluorescence microscopy image of 100 nm Tetraspec bead. (B) Linescan of intensity with overlaid Gaussian fit (black line in (A)). (C) Two pixel diameter circle (Object), calculated PSF (PSF), and resulting convolved image (Image). (D) Graph of apparent image diameter versus (Object Intensity/Image Intensity). Dotted line shows diameter cutoff below which we cannot accurately measure object intensities. Small objects ( < 20 pixel diameter) have diluted apparent intensities. (E–F) Comparison of droplet intensity measurements with and without correction. Droplets were formed with 1 μ M each of Nck (15% Alexa488), N-WASP, and pCas.
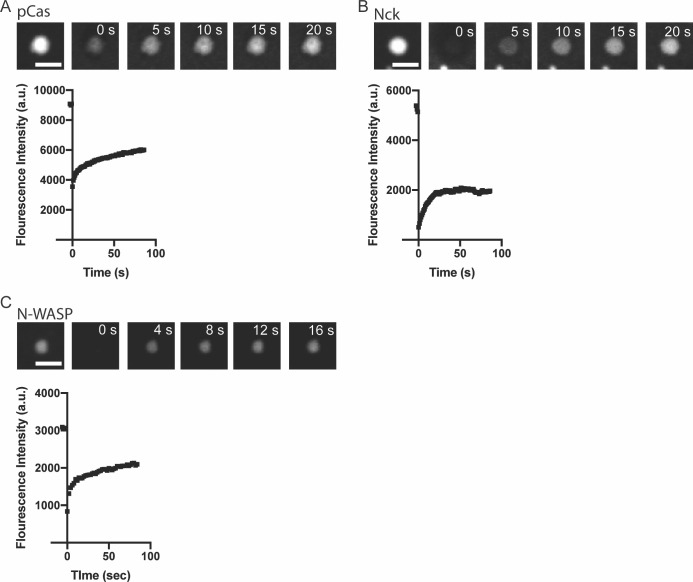
Figure 1—figure supplement 6. Representative fluorescence recovery after photobleaching (FRAP) data.

Figure 1—figure supplement 6.

(A) TOP: Representative spinning disk fluorescence images of pCas fluorescence recovery after photobleaching (FRAP) experiment. Droplets were formed with 1 μ M pCas (5% Alexa-568), 1 μ M nck and 1 μ M N-WASP, and a single droplet is bleached at t = 0 s. Bottom: Quantification of fluorescence intensity of the bleached droplet over time. (B) TOP: Representative spinning disk fluorescence images of nck FRAP experiment. Droplets were formed with 1 μ M pCas, 1 μ M nck (15% Alexa-488), and 1 μ M N-WASP, and a single droplet is bleached at t = 0 s. Bottom: Quantification of fluorescence intensity of the bleached droplet over time. (C) TOP: Representative spinning disk fluorescence images of N-WASP FRAP experiment. Droplets were formed with 1 μ M pCas, 1 μ M nck, and 1 μ M N-WASP (15% Alexa-647), and a single droplet is bleached at t = 0 s. BOTTOM: Quantification of fluorescence intensity of the bleached droplet over time. All scalebars = 5 μm.