
Figure 6. Integrin adhesion complexes are sensitive to genetic perturbations that alter Cas-dependent phase separation.
(A) In vitro solution turbidity measurements. 500 nM Nck and 1 µM N-WASP were combined with increasing concentrations of phosphorylated Cas (pCas, magenta) or Y15F Cas (black). Each point represents the mean ± SEM of three independent measurements. (B) Representation of in vitro experiments in C-D. (C) Spinning disk confocal fluorescence microscopy images of droplets formed with the Cas + FAK mix. TOP: 1 μM each of pCas, Nck, N-WASP, Kin, FAK, and paxillin (15% Alexa546); BOTTOM: 1 μM each of Y15F Cas, Nck, N-WASP, Kin, FAK, and paxillin (15% Alexa546). (D) Quantification of paxillin partitioning into droplets. Each condition contains at least 40 measurements from two independent experiments. (E) Spinning disk fluorescence microscopy images of MEFs with immunostaining for endogenous paxillin. (F) Quantification of number of adhesions. (G) Quantification of paxillin partitioning into adhesions (partition coefficient). Significance tested by one-way ANOVA followed by a Tukey multiple comparison test. In (C) scalebar = 5 μm. In (E) scalebar = 10 μm. Note that the pCas protein used in Figure 6 is a different batch than protein used in Figures 1—5 (See Figure 1—figure supplement 3).

Figure 6—figure supplement 1. Cas Y15F does not form droplets.
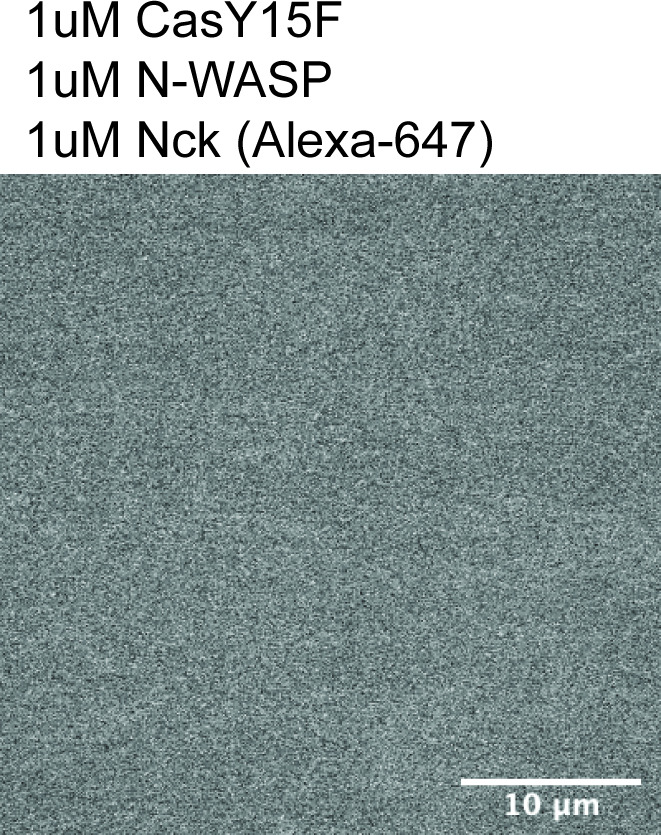
Figure 6—figure supplement 2. Measuring number of integrin adhesions during cell spreading.

Figure 6—figure supplement 3. Westernblot analysis of MEF cell lines.
