. 2022 Jan 26;11:e64543. doi: 10.7554/eLife.64543

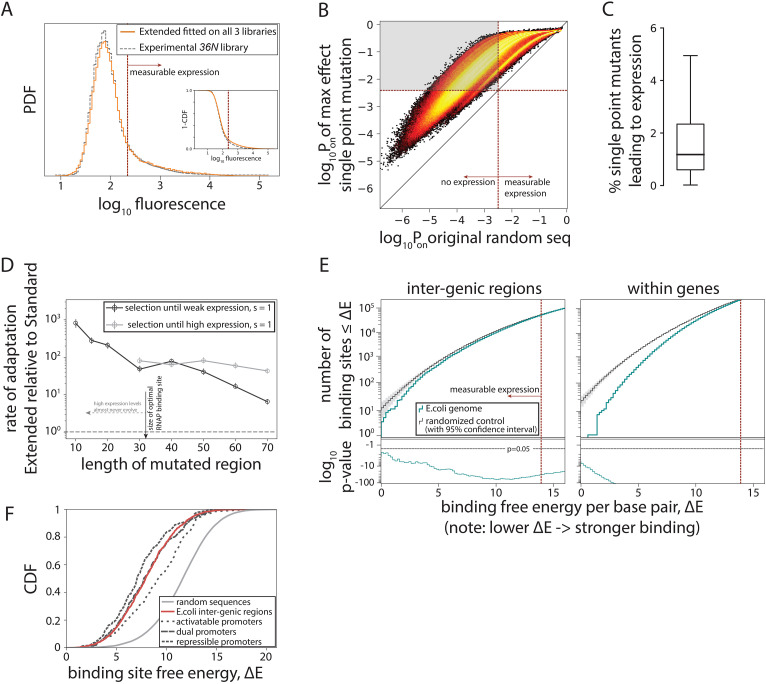
Figure 4. Evolution of promoters.

(A) Probability density function (PDF) for the flow cytometry measurement of the 36N library (gray dashed line) compared to the flow cytometry fluorescence intensities simulated from 106 randomly generated 115-bp-long sequences using the Extended model fitted on all three libraries. Red dotted line marks the cutoff for ‘measurable expression’, estimated from experimental data. Measurable expression is defined to correspond to the 99th percentile of fluorescence measurements of the experimental strain carrying no plasmid and, hence, no fluorescence. Inset: cumulative distribution function (CDF) for the same comparison. (B) Density heat map (brighter color represents higher density), showing, for every simulated random sequence (expression on x-axis), the expression of a single point mutant with the largest positive effect on predicted expression (Pon) (y-axis). For 82% of non-expressing random sequences (sequences left from the dotted line on the x-axis), that mutation led to measurable expression (gray area). (C) Box plot showing the percentage of all possible point mutations predicted to convert a given random non-expressing sequence into one with measurable expression (obtained from 105 random sequences). (D) Increase in rates of adaptive evolution of the Extended relative to the Standard model. Evolution to either weakest measurable expression, or high (PR) expression levels was modeled through single point mutations. Evolution was simulated 100 independent times for each of the 100 random 115-bp-long starting sequences, by mutating the central contiguous part of the indicated length. Evolving promoters would almost never reach high expression levels when only a region smaller than the RNA polymerase (RNAP) binding site (30 bp) was allowed to mutate. (E) For evidence of selection against σ70-RNAP binding sites, we compared the free energy per bp between either the inter-genic (typically, promoter containing) or the within-genic regions of the Escherichia coli genome, and that of a random sequence with the GC% of the corresponding region (note that higher energy means weaker binding and hence lower expression). At lower binding energies (corresponding to stronger binding), the actual number of binding sites in the E. coli genome (teal) is lower than expected based on random sequences (gray). Associated p-values are also shown. The total number of binding sites increases with binding energy (i.e. there are a lot more weaker than stronger binding sites), explaining the variability in p-values. (F) CDFs for predicted binding strengths of different E. coli promoters, obtained from RegulonDB. Figure 4—figure supplement 1 shows further details on how promoter evolution was modeled. Figure 4—figure supplement 2 contains the information about the contribution of cumulative binding to expression. Figure 4—figure supplement 3 shows additional tests for selection against σ70-RNAP binding sites.

Figure 4.

Figure 4—figure supplement 1. Modeling evolution.
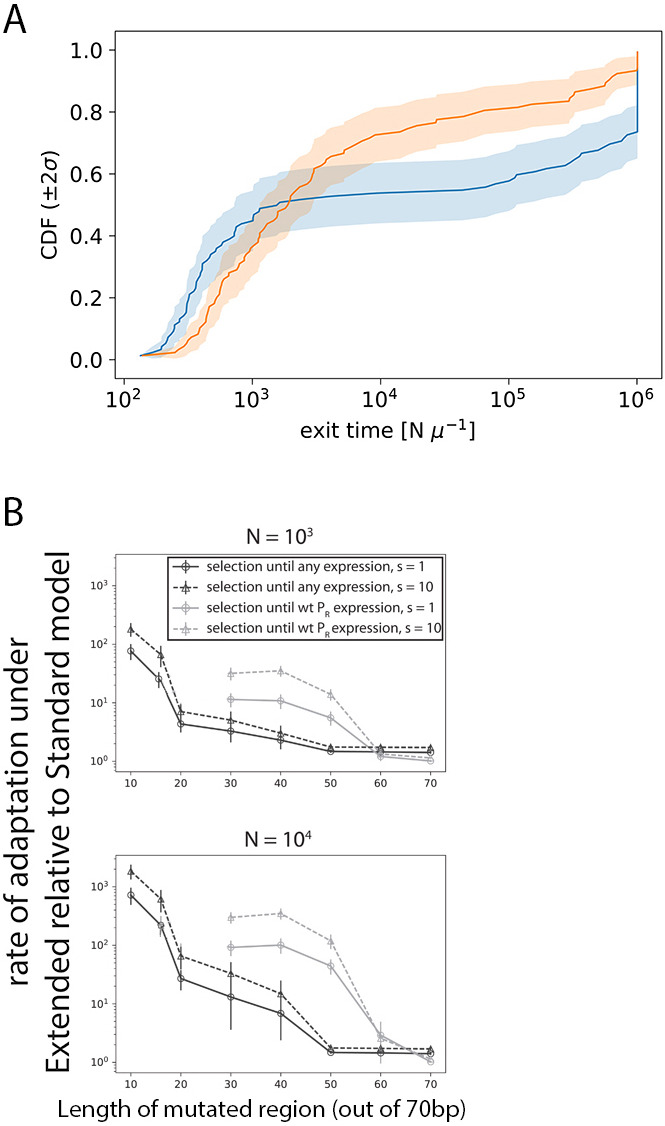
Figure 4—figure supplement 1.

(A) Cumulative distribution function (CDF) of the median times for promoter evolution under the Extended (orange) and Standard (blue) models for s = 1, N = 104, length of central mutagenized region of 70 bp and high target expression level (that of wildtype PR). Evolution was simulated 100 independent times for each of the 100 starting random sequences. We present this specific set of parameters as this is the case where the largest fraction of simulations stopped at 10 N iterations (our simulation limit), before reaching the target expression. For all parameter combinations, including the one shown here, more Standard model simulations terminate at 10 N iterations compared to Extended model simulations. Taking a ratio of the mean time under this CDF for the Extended model over that for the Standard model therefore represents a conservative lower bound for the speedup in promoter evolution. (B) Selection at two different population sizes (top panel: N = 103; bottom panel: N = 104) using the Strong-Selection-Weak-Mutation model at two selection strengths (s) and selecting to either PR-levels of expression or any measurable expression. Selection was simulated through 100 independent runs for each of the 100 random starting sequences, with different lengths of the sequence allowed to mutate. Errors bars are standard errors of the mean across all replicates and starting sequences. Indicated selection refers to the selection on the phenotype difference (Δlog10Pon).
Figure 4—figure supplement 2. Cumulative binding contributes more to expression at weak promoters.
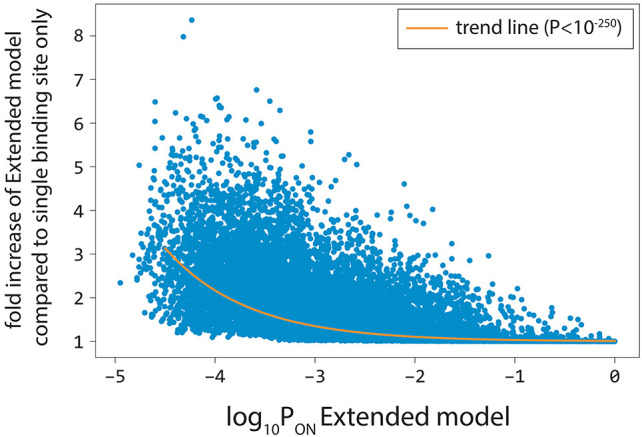
Figure 4—figure supplement 2.

For 100,000 random 100-bp-long sequences, we calculated the fold increase in predicted gene expression levels of the Extended model compared to the model that is constrained to only the single strongest σ70-RNAP binding site. Predicted expression levels from stronger promoters (higher log10Pon) were determined primarily by binding to the strongest σ70-RNAP binding site. In contrast, predicted gene expression levels at weak promoters were more likely to be determined by σ70-RNAP binding at multiple sites. The orange line is the trend line obtained through non-linear regression.
Figure 4—figure supplement 3. Further tests of selection against σ70-RNAP (RNA polymerase) binding sites.

Figure 4—figure supplement 3.

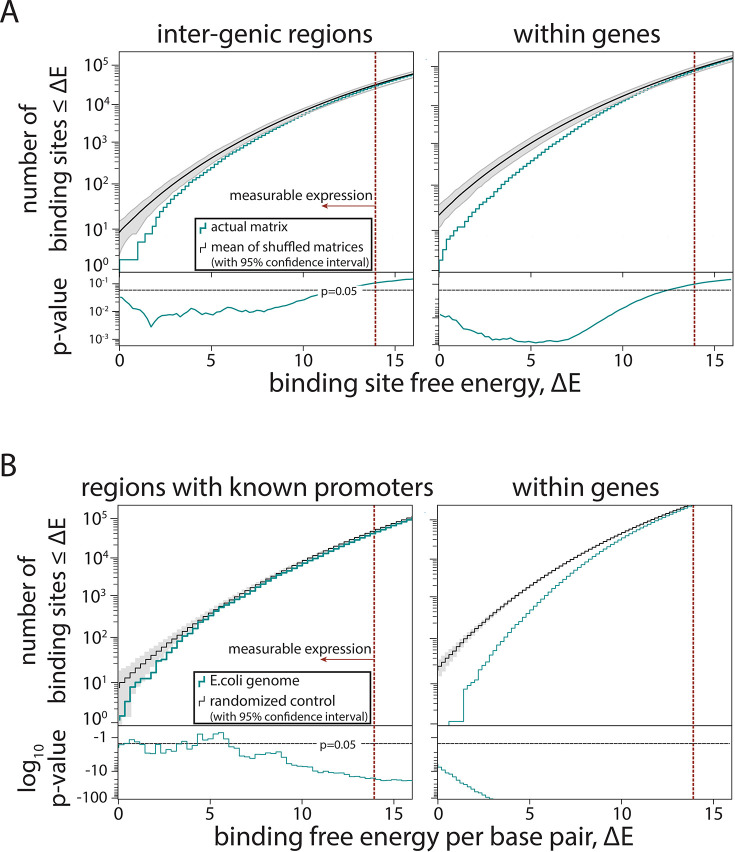
(A) To provide an alternative measure to that presented in Figure 4E, instead of creating a random sequence and comparing the number of predicted σ70-RNAP binding sites in it and in the Escherichia coli genome, here we created 100 shuffled σ70-RNAP energy matrices and used each of them to predict the expression from every single position in the E. coli genome. For each shuffle, we constructed cumulative histograms of free energy for inter-genic and within-genes regions. For each bin, we then calculated the p-value of the Extended model that used the actual σ70-RNAP energy matrix, assuming a normal distribution with mean and standard deviation given by the set of models with shuffled matrices. This is a conservative estimate, as for energies ΔE < 1, the assumption of Gaussian distribution leads to overestimates of standard deviation. The matrices were shuffled per position, that is, an energy matrix of dimension 4× L, with L being the length of the binding site, is shuffled by randomly reordering the L columns while leaving the energy entries in each column unchanged in order and magnitude. Gray lines represent 95% confidence intervals. (B) For evidence of selection against σ70-RNAP binding sites only in the inter-genic regions that contain experimentally confirmed promoters (based on RegulonDB), we compared model-predicted binding energy across the region to the expected binding for a 108 bp random sequence with the GC% of the corresponding region. Also shown is the selection against binding sites within genes (same as in Figure 4E). Gray shaded areas are 95% confidence intervals.