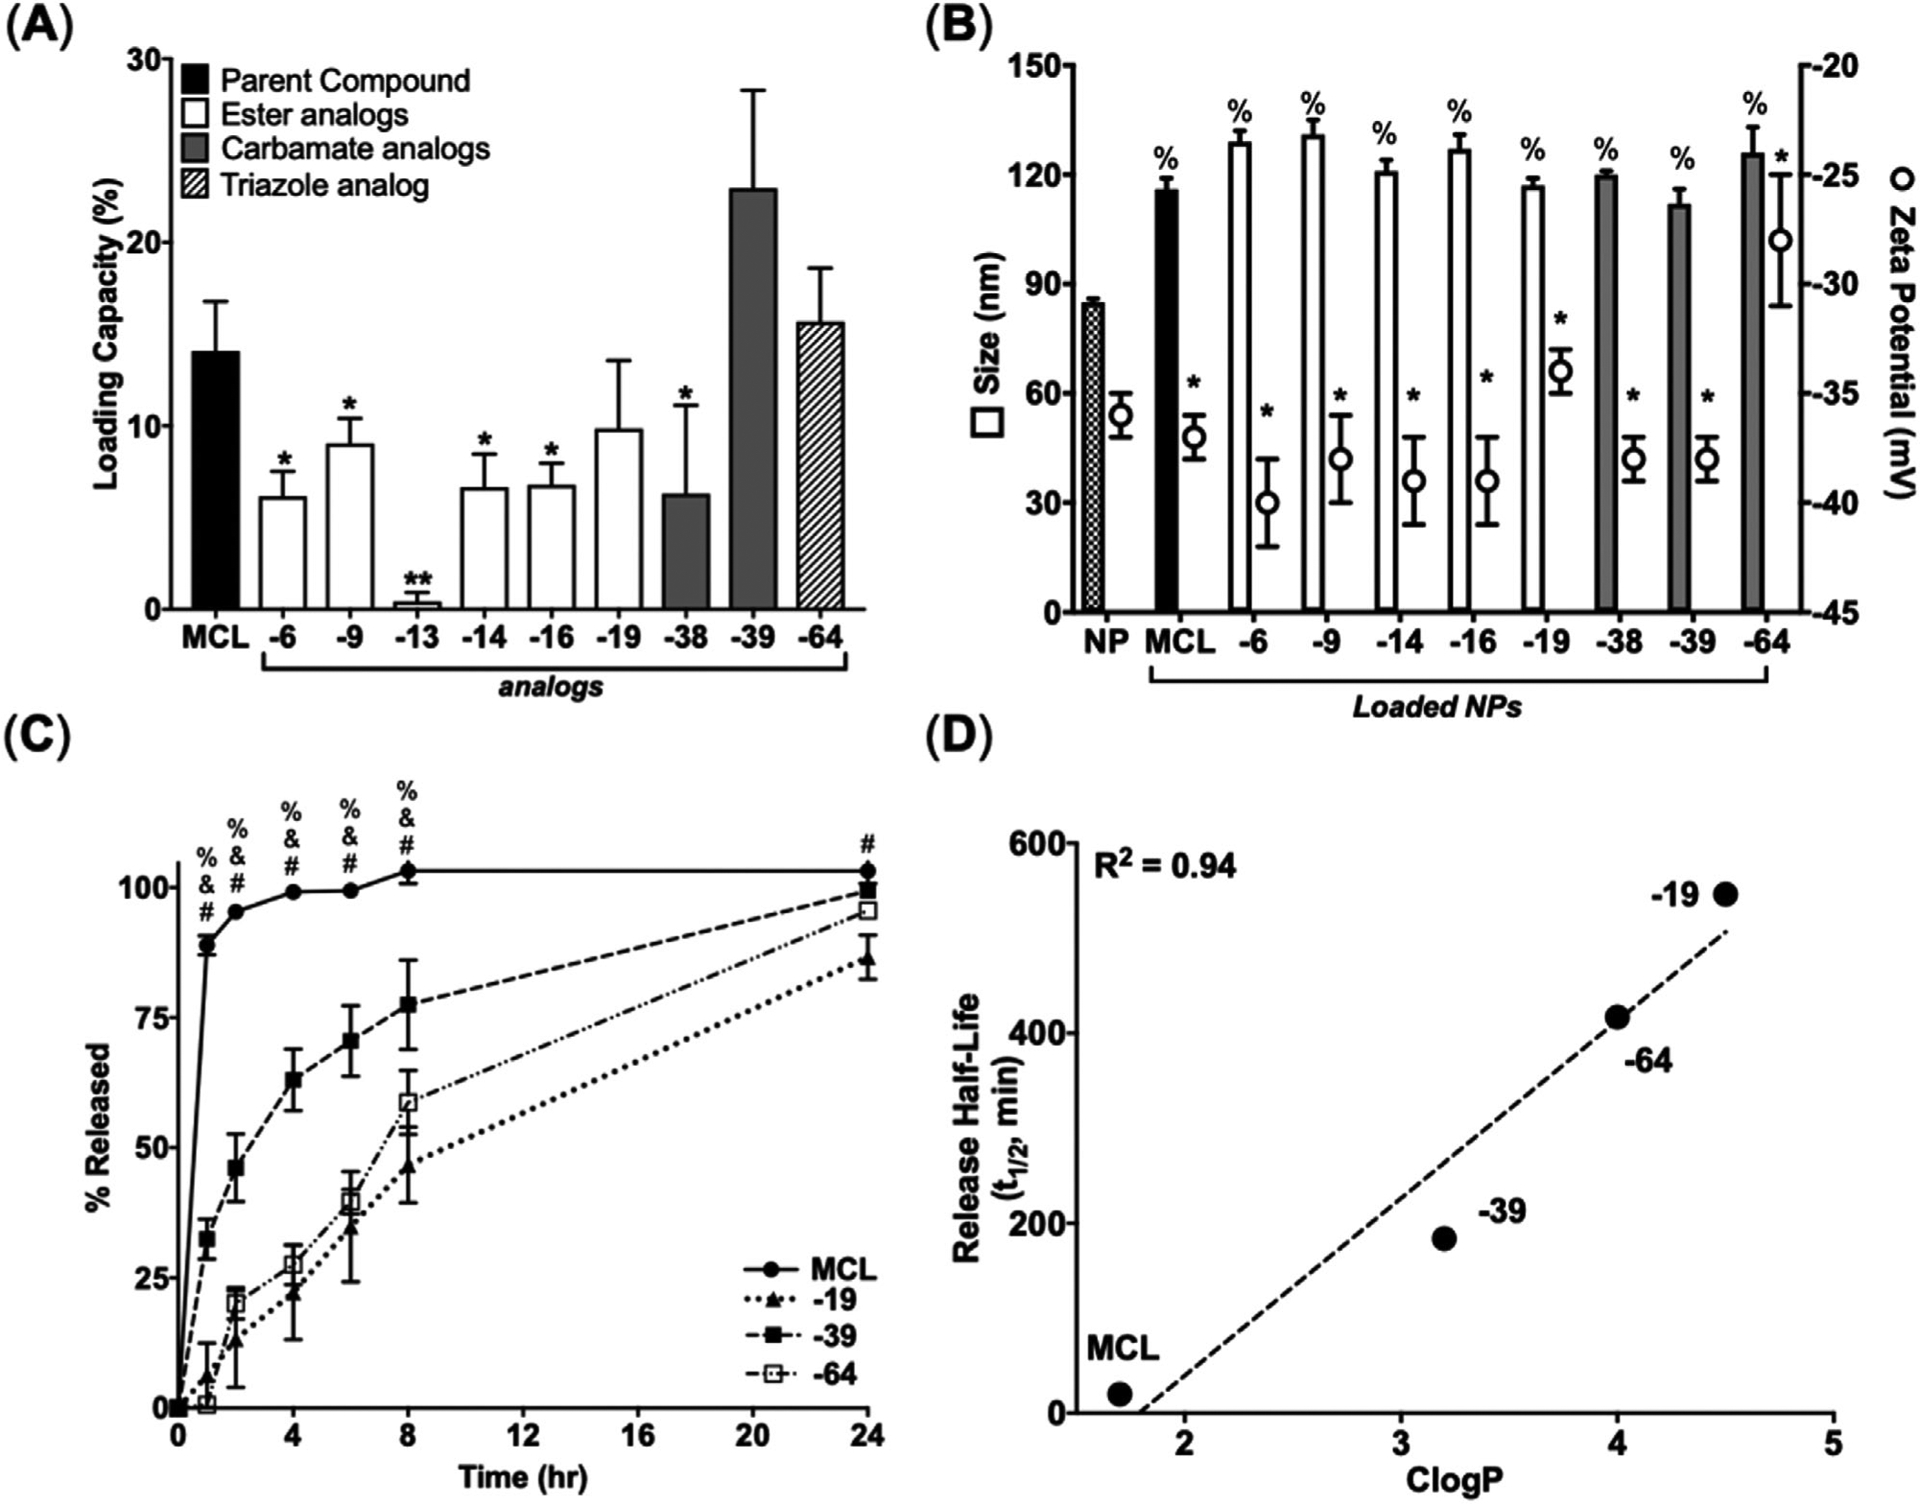
Figure 3.

Structural modifications of MCL impact loading in PSMA-b-PS NPs and hydrophobicity impact release from PSMA-b-PS NPs. A) LC for MCL and MCL analogs after loading. Data represent mean ± SD. (n = 3). *p < 0.05 and **p < 0.01 represents statistical differences between MCL and MCL analogs using unpaired two-tailed t-tests. B) Physiochemical properties of loaded NPs. *p < 0.05 represents statistical differences between MCL and MCL analogs for size and % p < 0.05 shows statistical differences comparing MCL and MCL analogs for zeta potential using one-way ANOVA followed by Dunnett’s multiple comparisons test. C) Cumulative release of MCL and MCL analogs from NPs. Data represent mean ± SD. (n = 3). %, & and # represents statistical differences between MCL and MCL-39, MCL-64, and MCL-19, respectively, at each time point using two-way ANOVA followed by Dunnett’s multiple comparisons test. D) Linear correlation between release half-life of MCL and selected MCL analogs plotted against their calculated partition coefficient (CLogP) as determined by ChemDraw.
