Figure 2.
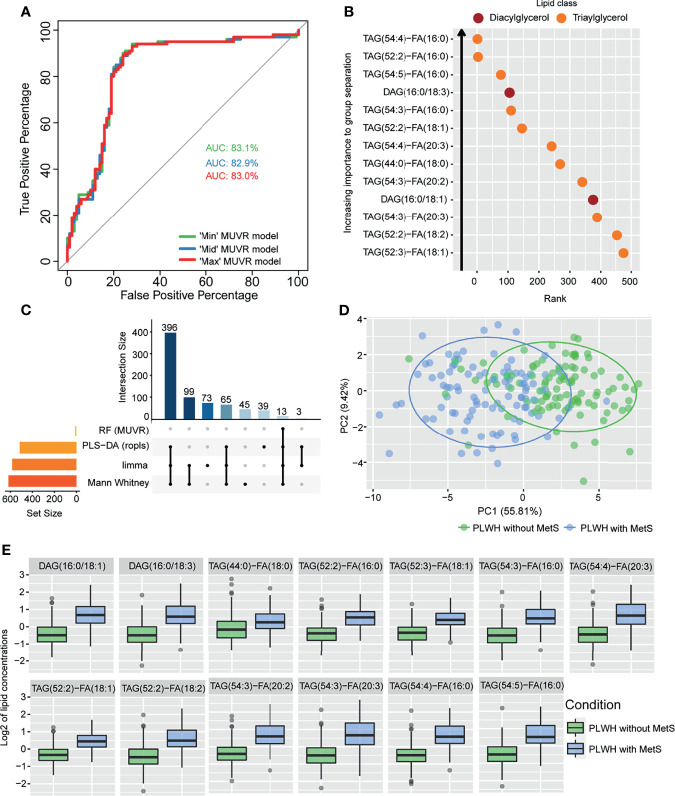
Lipidomics analyses of PLWH without MetS vs PLWH with MetS identifying key lipids differentiating the two groups. (A) Performance of random forest (RF) models. Receiver operating characteristic (ROC) curve with area under the curve (AUC) values for the three MUVR models. (B) Important prediction variables separating PLWH without MetS from PLWH with MetS based on lipidomics, diacylglycerol (DAG) and triacylglycerol (TAG). Variable’s importance on projection (VIP) scores plot for the ‘Max’ MUVR model, where lower rank indicates better group separation, thus better prediction variables in the model classification. (C) The intersection of methods identifying key lipids. UpSet plot showing number of significant lipids found via four statistical methods (RF, PLS-DA, limma, and Mann-Whitney U test). Note the 13 lipids (intersection size on the y-axis) are simultaneously identified by all four methods. (D) Separation of PLWH without MetS from PLWH with MetS based on identified key biomolecules. Principal component analysis (PCA) on key biomolecules, where lipidomics and metabolomics data were separated by the 13 identified key lipids and 11 identified key metabolites ( Table 2 ). Ellipses show the 95% confidence interval of the data. (E) Boxplot of lipid concentration of the identified key lipids, which consist of DAGs and TAGs.

