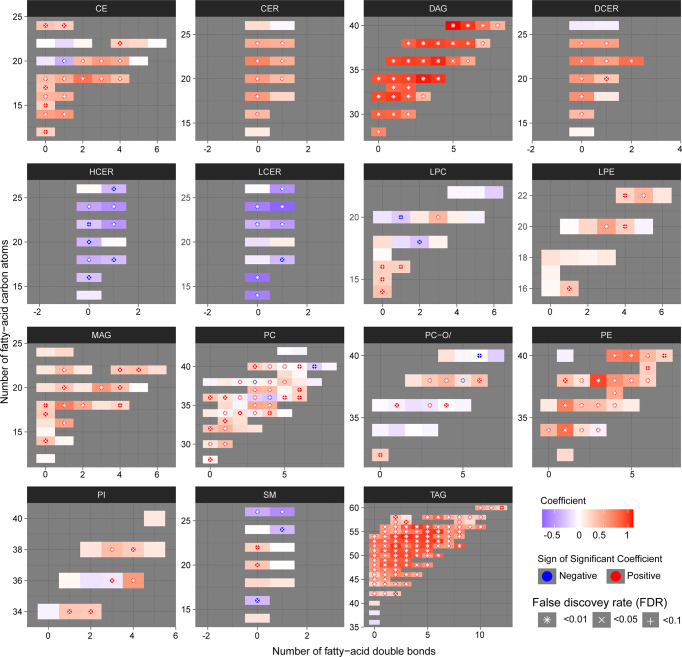
Figure 3.
Structural differences of the lipidomic profile of PLWH without MetS vs. PLWH with MetS. Heatmaps for each lipid class show the structural lipid composition differences between PLWH without MetS and PLWH with MetS. Each lipid species is shown as a rectangle and the color shows the abundance difference (red: higher in PLWH with MetS; white: no difference; blue: lower in PLWH with MetS), the lipids were organized by the lipid size (y-axis) and level of saturation (x-axis). Lipids with statistically significant differences between the two groups were highlighted with a symbol. P-values have been FDR adjusted.

