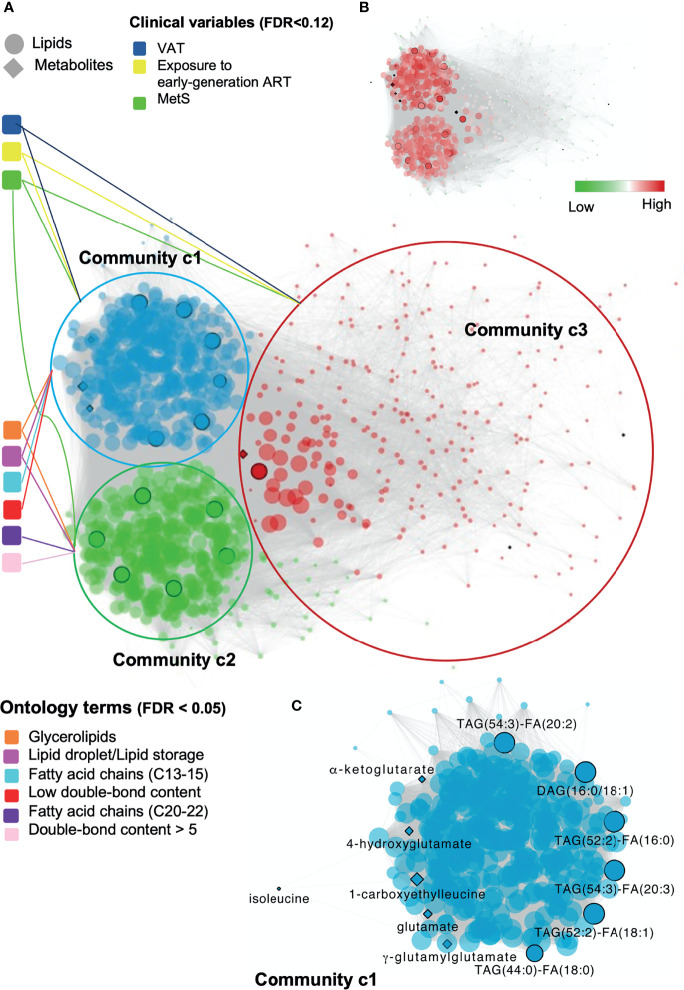
Figure 4.
Global and local biomolecular network of PLWH without MetS vs PLWH with MetS. (A) Global network illustrating the associated clinical variables and ontology terms with each community. Network of positive correlations between lipids and metabolites (FDR < 1e-07, Spearman’s ρ > 0.38), colored based on the three identified communities, c1 (blue), c2 (green) and c3 (red). Communities are connected with associated clinical variables (FDR < 0.12) and ontology terms (FDR < 0.05). Black circled lipids and metabolites correspond to identified key lipids and key metabolites ( Table 2 ). (B) Global network illustrating up and down-regulated lipids in PLWH with HIV. (C) Local network of community c1 highlighting key biomolecules. Biomolecular correlations within community c1 (FDR < 1e-07, Spearman’s ρ > 0.38). Black circled and named biomolecules correspond to the identified key lipids and metabolites within c1.

