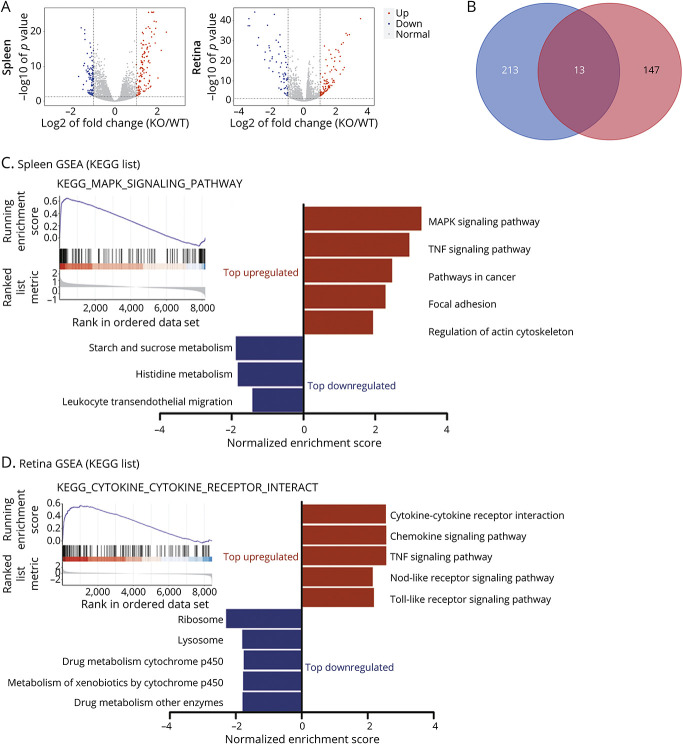
Figure 5. DEG Screening and GSEA Analysis.
(A) Volcano plots showed DEGs in the spleen and retina between the PGRN−/− EAU group (knockout (KO) n = 4) and the WT EAU group (WT n = 4). The red dots represent upregulated DEGs, whereas the blue dots represent the downregulated DEGs. Nonchanged genes are shown in gray color. (B) Venn diagram showed the shared 13 DEGs both in the spleen and in the retina. (C and D) The bar graphs showed normalized enrichment scores of GSEA on KEGG gene sets for RNA-seq analysis in the (C) spleen and (D) retina between WT and PGRN−/− EAU group. The figure presented the top 5 of significant gene sets (FDR <0.05). Upregulated and downregulated gene sets are highlighted in red and blue, respectively. In the spleen, there were only 3 downregulated gene sets. Upper left of the figure shows the enrichment plot of MAPK signaling pathway and cytokine-cytokine receptor interaction gene sets, respectively. DEG = differentially expressed genes; EAU = experimental autoimmune uveitis; FDR = false discovery rate; GSEA = gene set enrichment analysis; PGRN = progranulin; WT = wild type.

