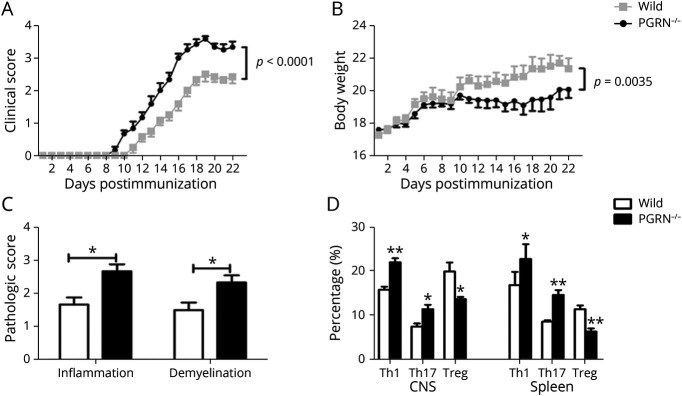
Figure 6. PGRN−/− Mice Develop More Severe EAE.
WT and PGRN−/− mice of C57BL/6 background were induced for EAE. (A and B) Quantification of clinical score and body weight of the 2 groups from day 7 to day 22. (C) Quantification of inflammation and demyelination of the spinal cord from the 2 EAE mice groups at day 22 postimmunization and hematoxylin and eosin staining of the spinal cord sections for analyzing the degree of inflammation. Luxol fast blue staining of spinal cord sections for analyzing the degree of demyelination. (D) Quantitative analysis the frequency of IFN-γ+CD4+ T cells (Th1), IL-17+CD4+ T cells (Th17), and Foxp3+CD4+ T (Treg) cells in the CNS (brain and spinal cord) and spleen by flow cytometry. Data are shown as mean ± SEM from 3 independent experiments with a total of at least 10 mice per group. *p < 0.05, **p < 0.01. EAA = experimental autoimmune encephalomyelitis; IL = interleukin; IFN = interferon; PGRN = progranulin; Th = T helper; Treg = regulatory T; WT = wild type.

