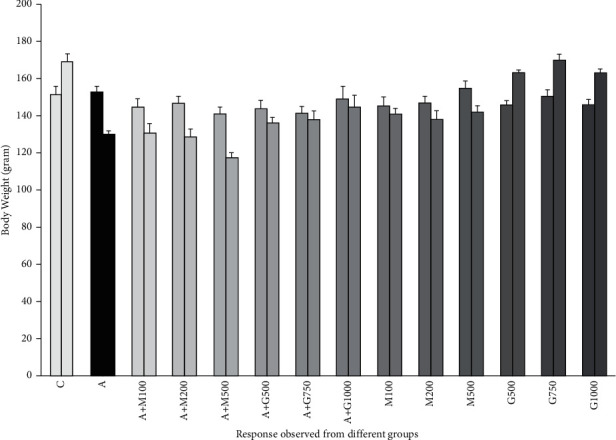
Figure 2.

Body weight of rats before the initiation and after the termination of the experiment. Values were expressed as mean ± SD (C = control group, A = alloxan-induced group, M = metformin, A + M = alloxan + metformin, A + G = alloxan + Gynura, and G = G. procumbens).
