
Figure 7.
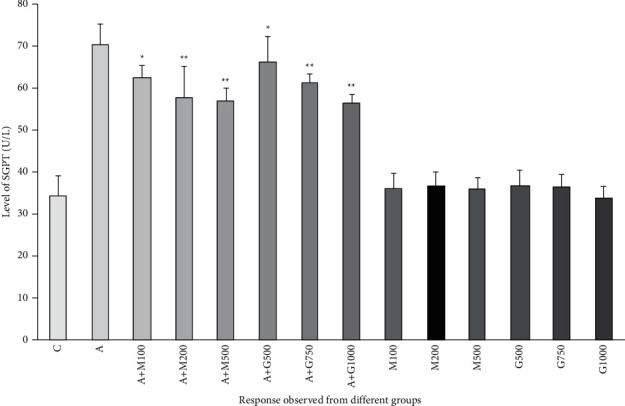
SGPT level of rats belonged to 14 groups throughout receiving respective treatments. Values were expressed as mean ± SD (n = 10/group). ∗p < 0.05 and ∗∗p < 0.01 indicate significant difference from the disease group (C = control group, A = alloxan-treated group, M = metformin, A + M = alloxan + metformin, A + G = alloxan + Gynura, and G = G. procumbens).