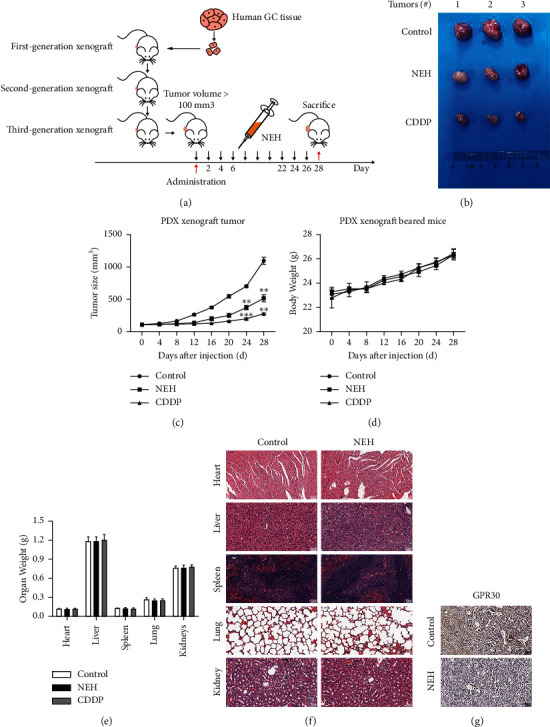
Figure 4.

NEH inhibited gastric cancer in the PDX model. (a) Flowchart on the construction of PDX model and antitumor test of NEH in vivo. (b) Representative image of negative control, positive control (cisplatin/CDDP, 5 mg/kg), and NEH (25 mg/kg) treated tumors. n = 3 per group. (c) The volume of the tumors changed throughout the experiment. Volume = length × width2 × 1/2. Changes in body weight (d) and organ weight of major organs (e) in mice. (f) H&E staining of main organs of mice. (g) Immunohistochemical analysis of GPR30. ∗∗P < 0.01, ∗∗∗P < 0.001, compared with the control group.
