Figure 4.

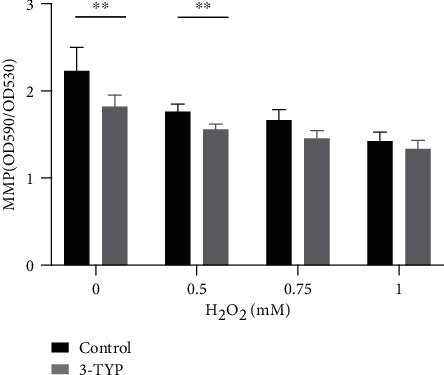
Comparison of MMP levels in the 0, 0.5, 0.75, and 1 mM groups between matched nontreated and 3-TYP-treated groups. Data are expressed as means ± SD (n = 5 organ of Corti per concentration). ∗P < 0.05, ∗∗P < 0.01, and ∗∗∗P < 0.001.

Comparison of MMP levels in the 0, 0.5, 0.75, and 1 mM groups between matched nontreated and 3-TYP-treated groups. Data are expressed as means ± SD (n = 5 organ of Corti per concentration). ∗P < 0.05, ∗∗P < 0.01, and ∗∗∗P < 0.001.