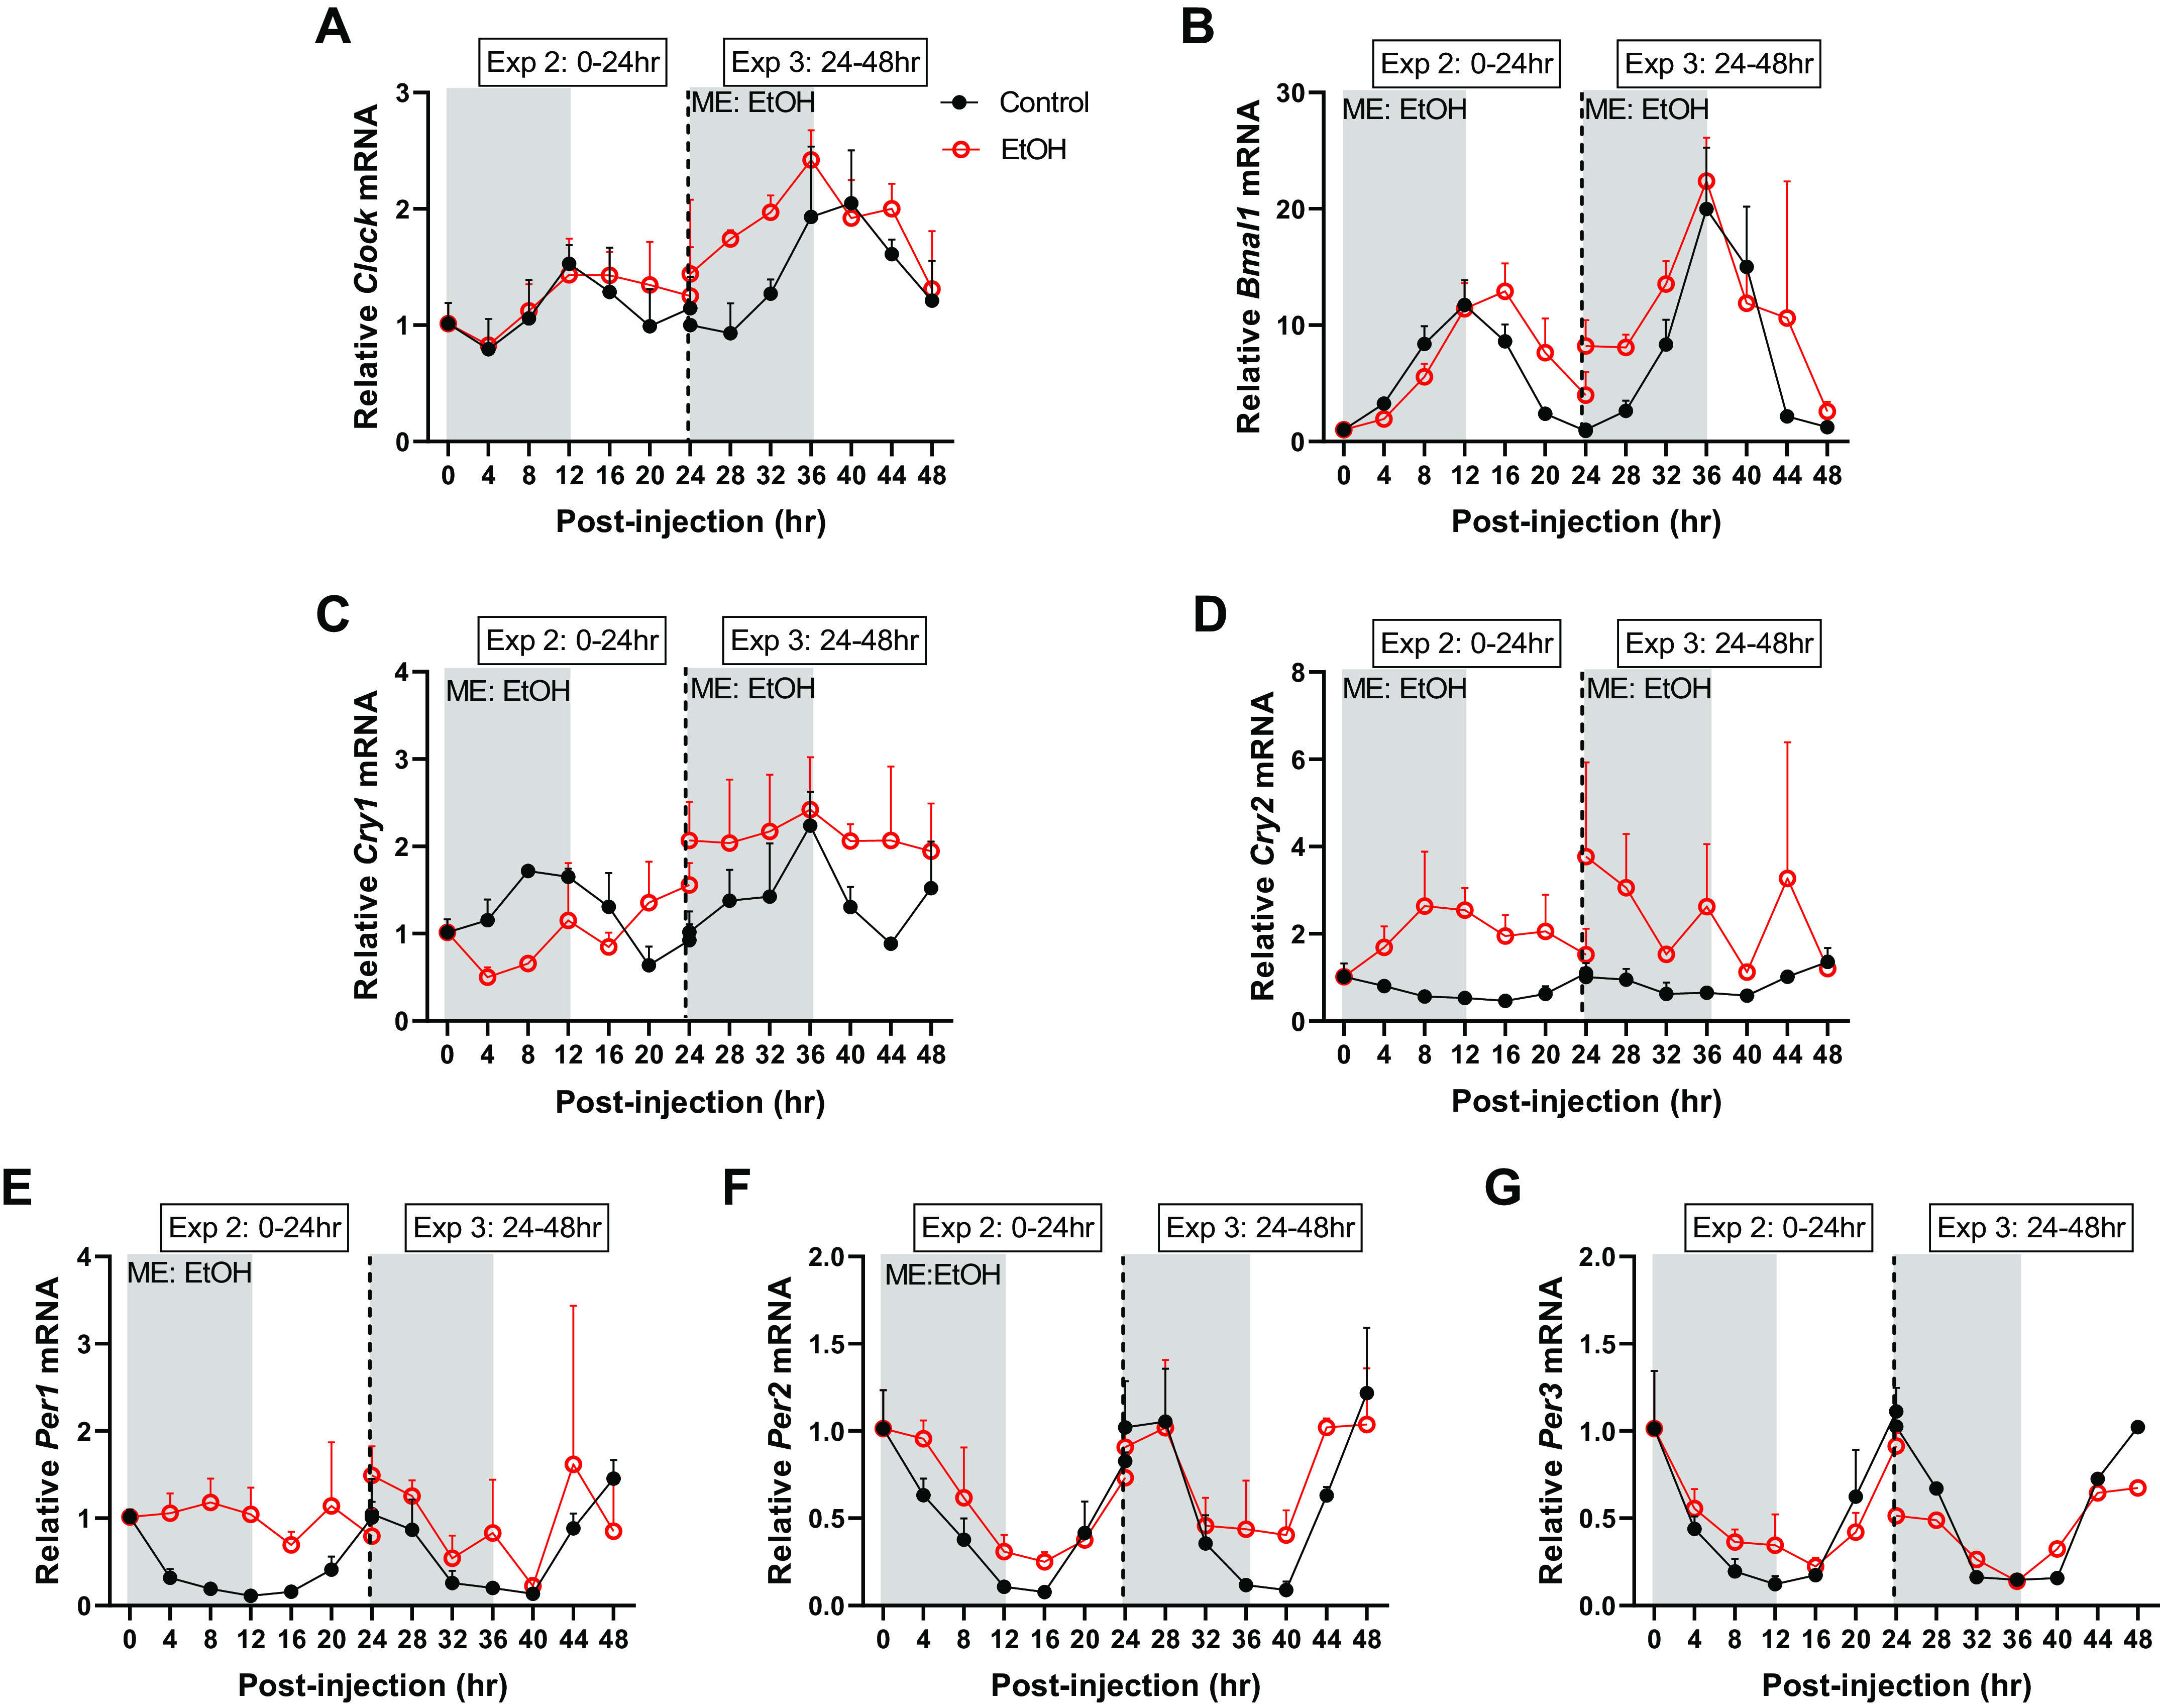
Figure 1.

The effects of acute alcohol intoxication on mRNA expression of core clock components, Clock (A), Bmal1 (B), Cry1 (C), Cry2 (D), Per1 (E), Per2 (F), and Per3 (G) from experiment 2 (0–24 h) and experiment 3 (24–48 h), for gastrocnemius. The vertical dotted line represents the division of the two experiments, and gray boxes depict the dark cycle, whereas white boxes depict the light cycle. The 0-h time point is the time of injection and baseline tissue collection (n = 3). The black spheres represent control (n = 3), and the open red spheres represent EtOH (n = 3). Data are presented as means ± SD for each time point. Main effects and interactions were determined by two-way ANOVA (Time, EtOH) where P ≤ 0.05, and the main effect of alcohol is displayed on the graph as ME: EtOH.
