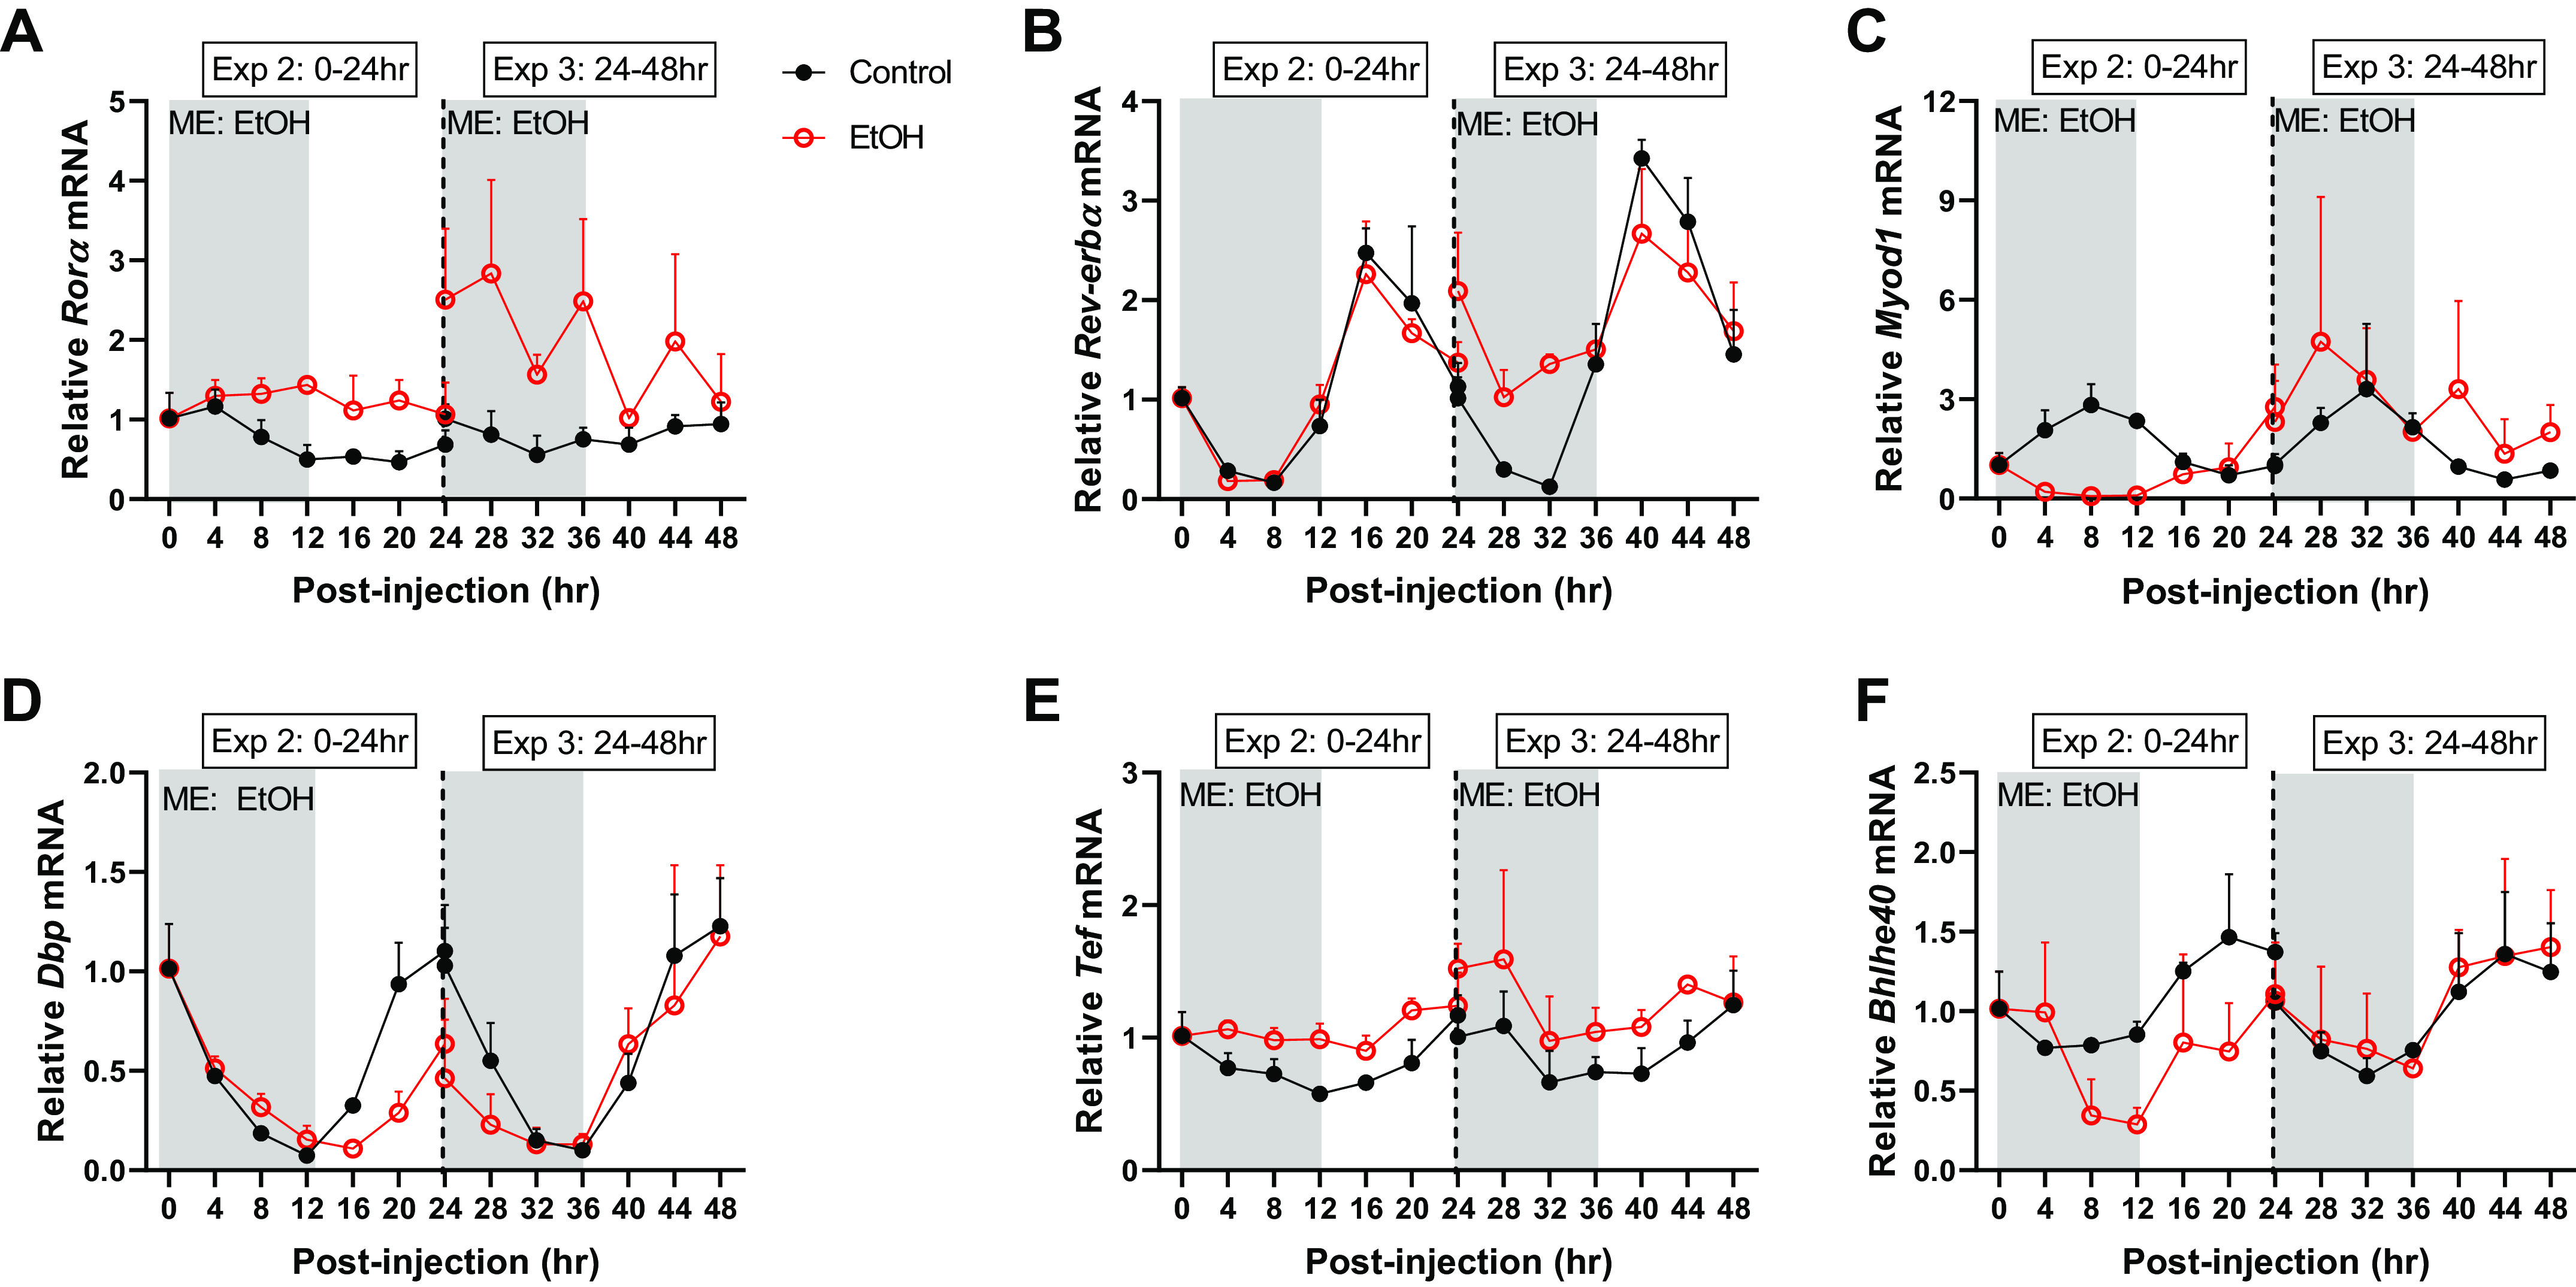
Figure 2.

The effects of acute alcohol intoxication on mRNA expression of CCGs, Rorα (A), Rev-erbα (B), Myod1 (C), Dbp (D), Tef (E), and Bhlhe40 (F) in experiment 2 (0–24 h) and experiment 3 (24–48 h). The vertical dotted line represents the division of the two experiments, and gray boxes depict the dark cycle, whereas white boxes depict the light cycle. The 0-hr time point is the time of injection and baseline tissue collection (n = 3). The black spheres represent control (n = 3), and the open red spheres represent EtOH (n = 3). Data are presented as means ± SD for each time point. Main effects and interactions were determined by two-way ANOVA (Time, EtOH) where P ≤ 0.05 and the effect of alcohol is displayed on the graph as ME: EtOH.
