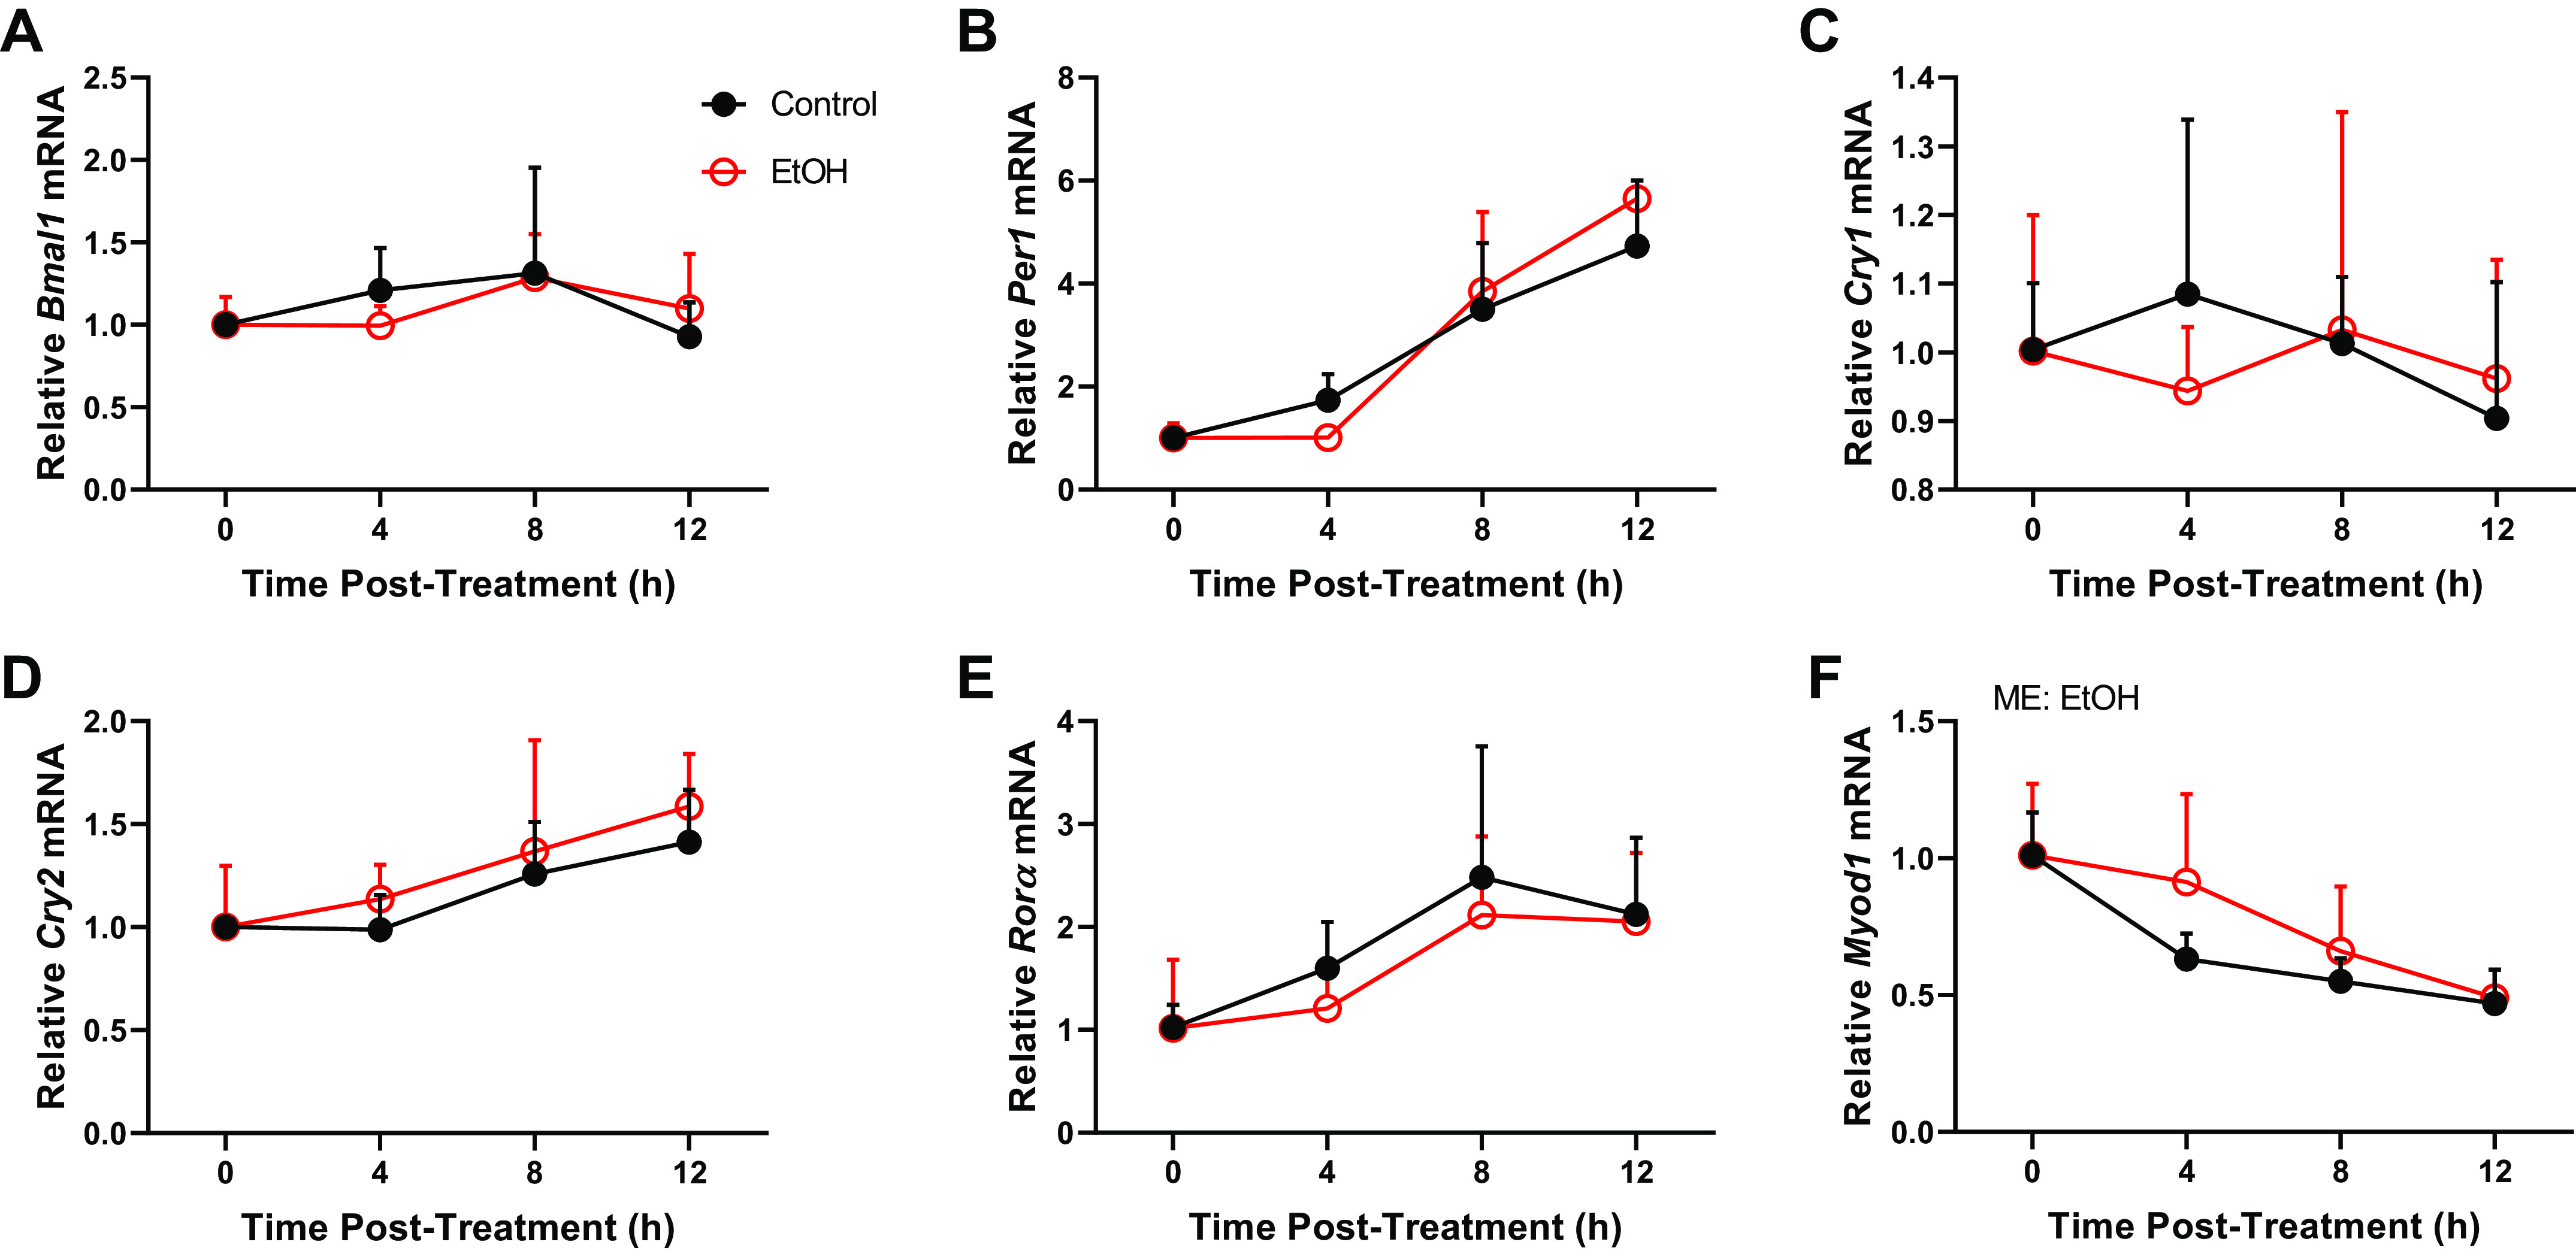
Figure 4.

The effects of ethanol exposure (100 mM) on C2C12 myotubes on the mRNA expression of core clock components and CCGs, Bmal1 (A), Per1 (B), Cry1 (C), Cry2 (D), Rorα (E), and Myod1 (F) from experiment 4 (0–12 h) presented as means ± SD (P ≤ 0.05). Main effects and interactions were determined by two-way ANOVA (Time, EtOH) where P ≤ 0.05 and the effect of alcohol is displayed on the graph as ME: EtOH.
