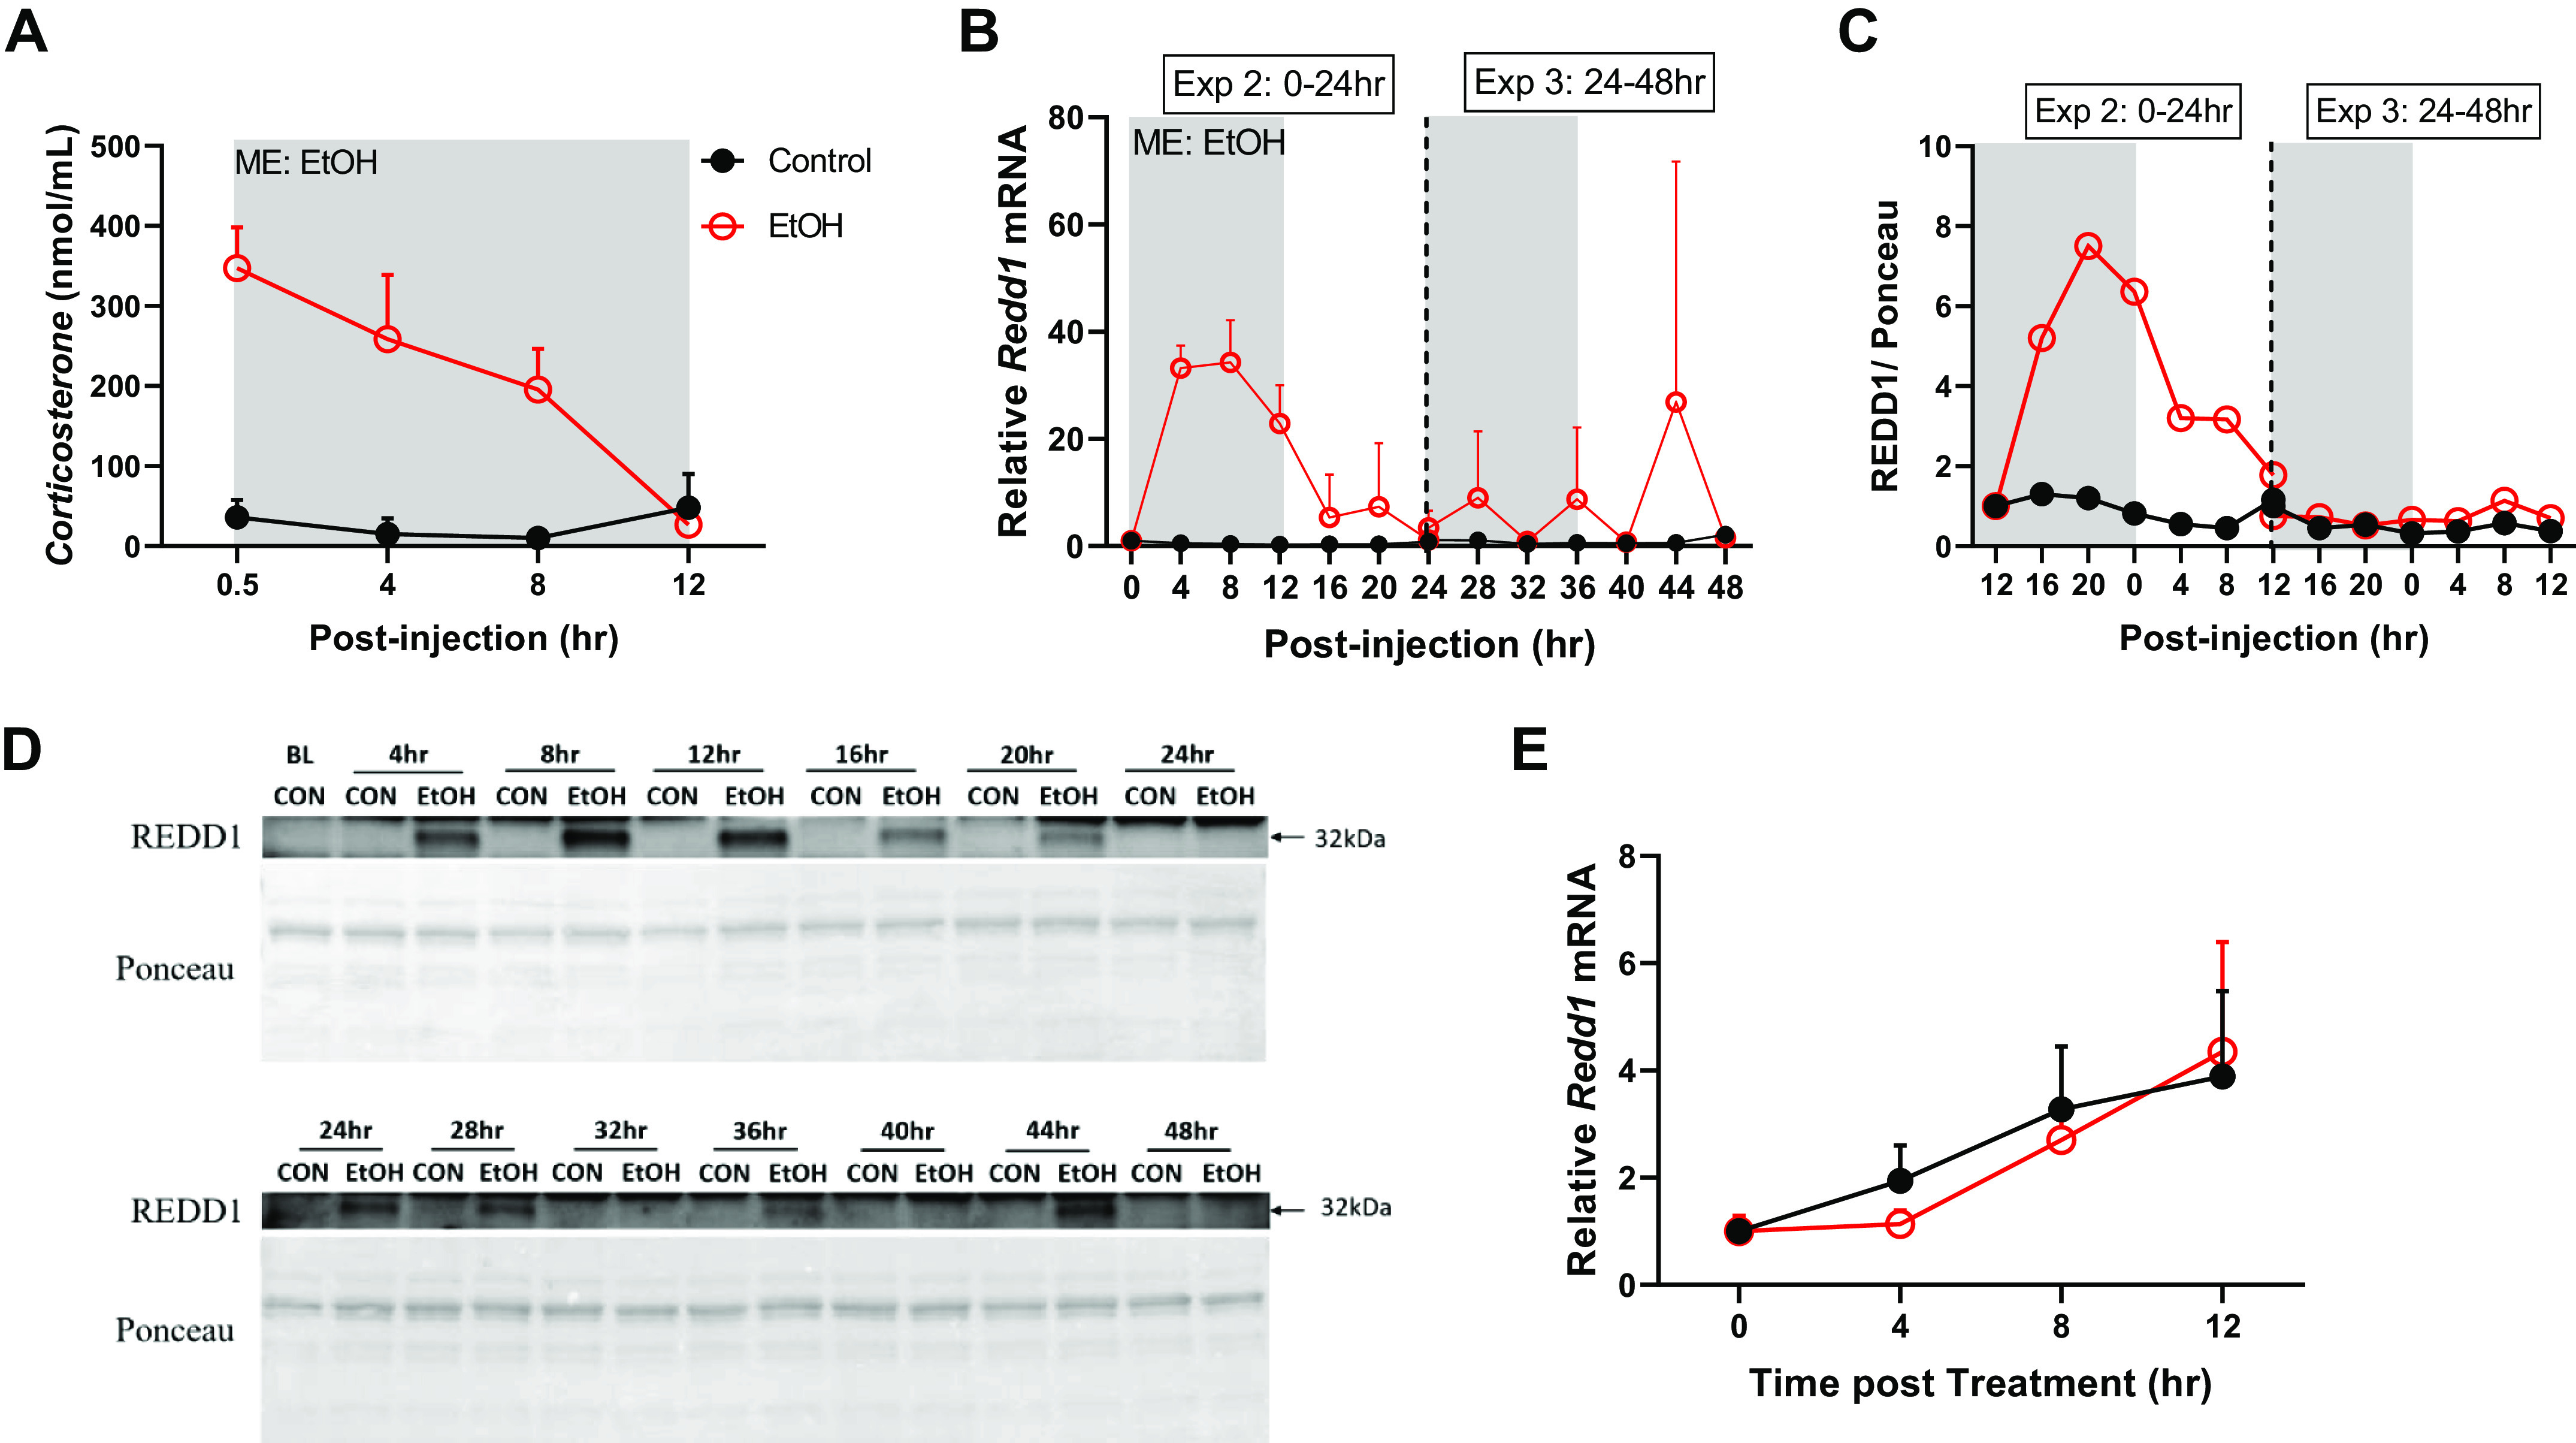
Figure 5.

The effects of acute alcohol intoxication on serum corticosterone (A) and the mRNA expression of Redd1 (B) from experiment 2 (0–24 h), experiment 3 (24–48 h), and experiment 4 (0–12 h). In B and C, the vertical dotted line represents the division of the two experiments and gray boxes depict the dark cycle, whereas white boxes depict the light cycle. The 0-h time point is the time of injection and baseline tissue collection (n = 3). The black spheres represent control (n = 3), and the open red spheres represent EtOH (n = 3). C: REDD1 protein over the 48-h period with the corresponding Western blot images shown in D. E: the mRNA expression of Redd1 from experiment 4 in C2C12 myotubes treated with alcohol (100 mM) for 12 h (n = 3/replicate; 3 replicates were performed). A two-way ANOVA (Time, EtOH) was used to determine effects of alcohol listed. Main effects and interactions were determined by two-way ANOVA (Time, EtOH) where P ≤ 0.05 and the effect of alcohol is displayed on the graph as ME: EtOH. All data are presented as means ± SD.
