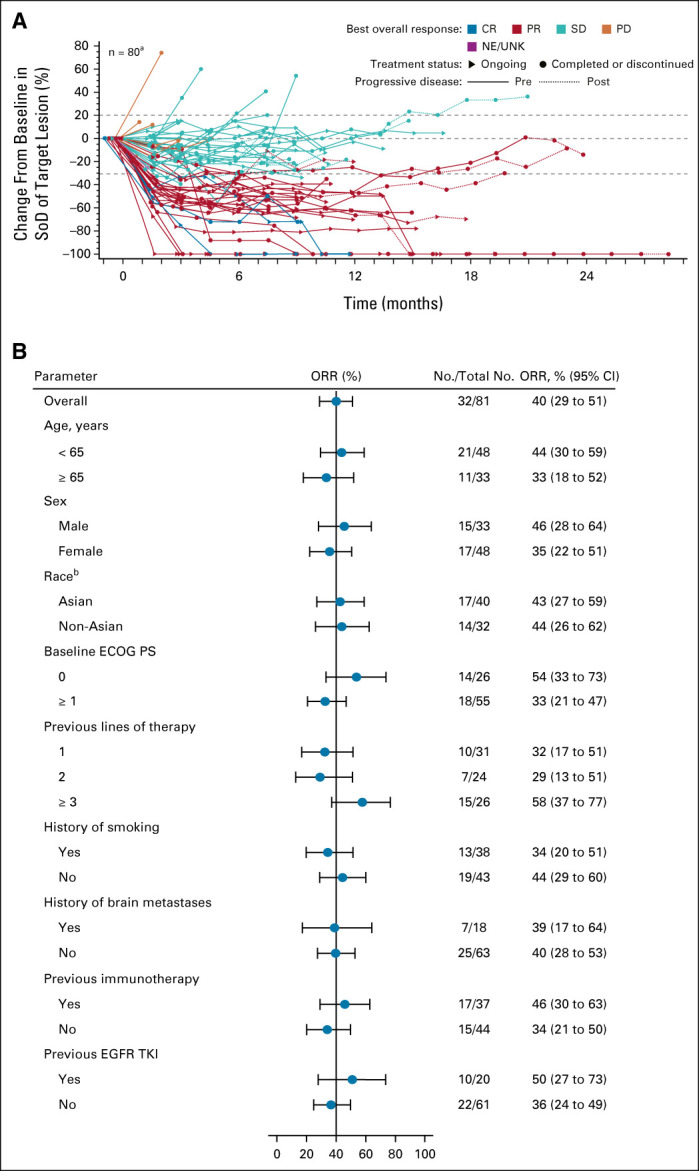
FIG 2.

Tumor response over time and ORR by subgroups. (A) Spider plot of percent change from baseline in sum of target lesion diameters over time in the efficacy population (n = 81) as assessed by BICR. aOne patient discontinued before any disease assessment and is not included in the plot. Dotted lines at 20% and –30% indicate thresholds for PD and PR, respectively, as per RECIST, v1.1. (B) Results of prespecified (age, sex, race, baseline ECOG PS, history of smoking, and previous immunotherapy) and post hoc (history of brain metastases, previous lines of therapy, and previous EGFR TKI) subgroup analysis of ORR in the efficacy population on the basis of BICR. bDoes not include nine patients with race not reported and multiple race. BICR, blinded independent central review; CR, complete response; ECOG PS, Eastern Cooperative Oncology Group performance status; EGFR, epidermal growth factor receptor; NE, not evaluable; ORR, overall response rate; PD, progressive disease; PR, partial response; SD, stable disease; SoD, sum of lesion diameters; TKI, tyrosine kinase inhibitor; UNK, unknown.
