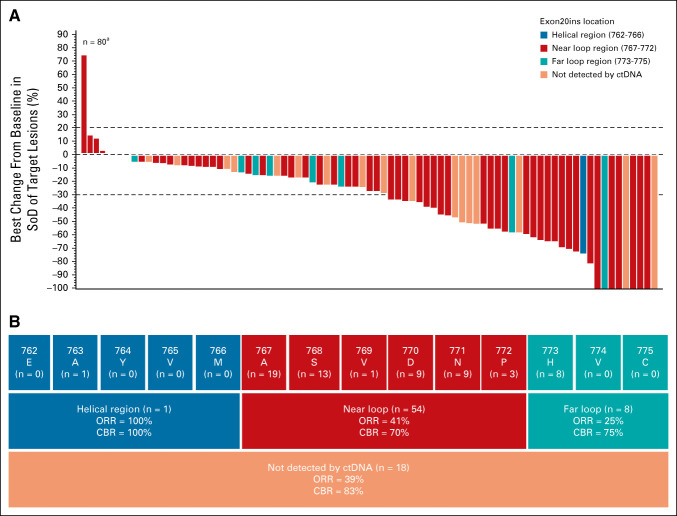
FIG 3.
Tumor reduction and responses in the efficacy population. (A) Waterfall plot displaying best percent change from baseline in sum of target lesion diameters by location of EGFR Exon20ins (determined by Guardant360 testing) for patients in the efficacy population (n = 81) as assessed by BICR. aOne patient discontinued before any disease assessment and is not included in the plot. Dotted lines at 20% and –30% indicate thresholds for progressive disease and partial response, respectively, as per RECIST, v1.1. (B) Insertion regions of EGFR Exon20ins identified in the efficacy population and ORR as assessed by BICR for each key region of exon 20 (blue, red, and teal boxes). Site of EGFR Exon20in could not be identified by ctDNA analysis for 18 patients (dark orange). BICR, blinded independent central review; CBR, clinical benefit rate; ctDNA, circulating tumor DNA; EGFR, epidermal growth factor receptor; Exon20ins, exon 20 insertion; ORR, overall response rate; SoD, sum of lesion diameters.

