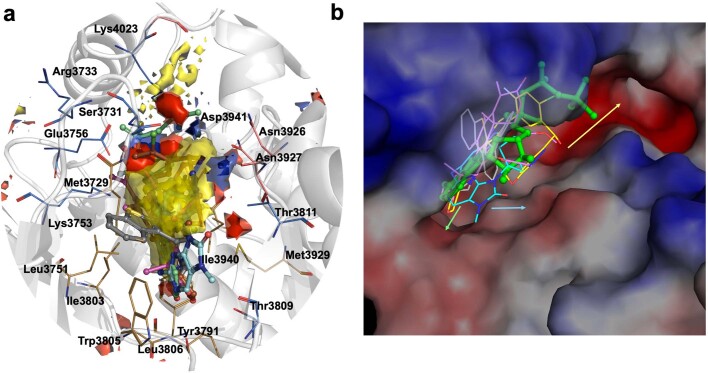
Extended Data Fig. 5. Hotspot analysis for further structure-guided inhibitor development.
a, Hotspot map of DNA-PKcs ATP binding site contoured at 14. The apolar, donor and acceptor hotspot regions are depicted as yellow, blue and red surfaces with the key contributing residues shown as brown, salmon and blue lines respectively. ATPγS-Mg2+2 is shown in green stick-ball representation with inhibitors wortmannin (grey), NU7441 (pink), AZD7648 (blue) and M3814 (brown) overlaid. b, Surface electrostatic representation of DNA-PKcs in complex with ATPγS (green stick-ball) and inhibitors wortmannin (grey), NU7441 (pink), AZD7648 (blue) and M3814 (yellow) overlaid as lines. AZD7648 and M3814 are seen extending to the edge of the ATP pocket due to unique interactions with residues near the catalytic loop, not seen with the other two inhibitors. Additional lead optimization may involve elaborating compounds to utilize interactions on the catalytic loop (blue arrow) and base of C-lobe (green arrow). Growing compounds further into the groove (yellow arrow) occupied by the activation loop, thereby engaging additional polar and electrostatic contacts, allows extension further away from the ATP binding site.

