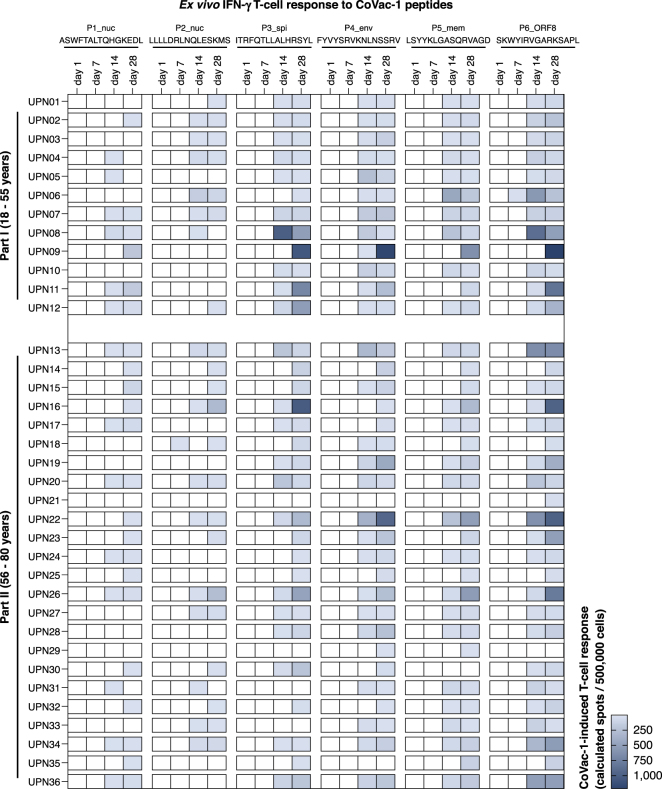
Extended Data Fig. 2. Intensities of CoVac-1-induced T cell responses ex vivo assessed in IFNγ ELISPOT assays.
Heatmap of CoVac-1-induced T cell response intensities (calculated spots per 500,000 cells, color gradient blue) to single CoVac-1 peptides (nuc, nucleocapsid; spi, spike; env, envelope; mem, membrane; ORF, open reading frame) in ex vivo IFNγ ELISPOT assays using PBMCs from study participants (uniform participant number, UPN) of part I (n = 12) and part II (n = 24) before vaccination (day 1) and at different time points after vaccination (day 7, day 14, day 28).

