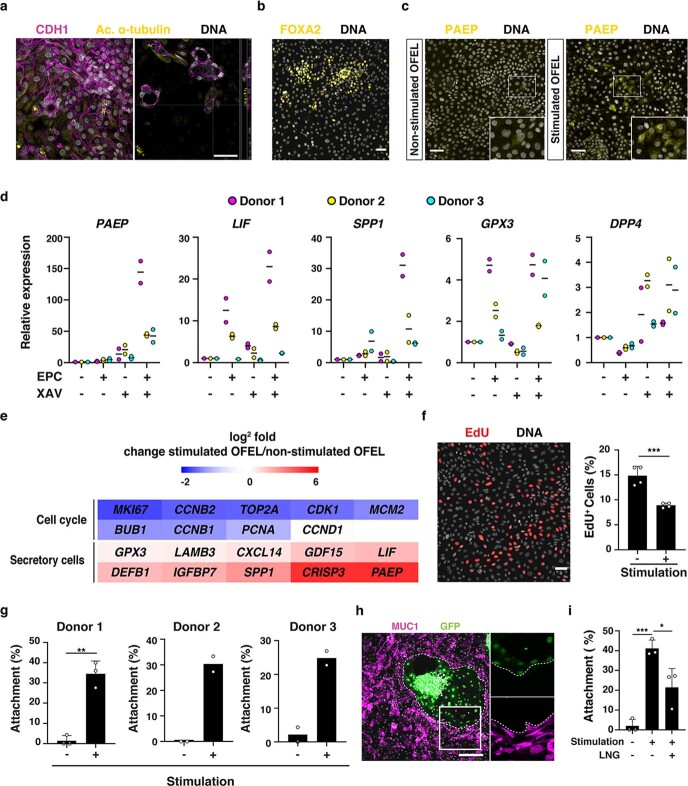
Extended Data Fig. 8. Human blastoids recapitulate aspects of implantation.
a. Immunofluorescence stainings for CDH1 (Magenta) and a ciliated cell marker acetylated α-tubulin (Yellow) in OFELs (left). Y-Z plane shows the apical location of the cilia (right). Scale bar: 50 μm. b. Immunofluorescence staining for FOXA2 (Yellow) marking the endometrial glandular cells in OFELs. Scale bar: 50 μm. c. Immunofluorescence staining for PAEP (Yellow) in non-stimulated (left) and stimulated (right) OFELs. d. qRT-PCR measurement of the expression levels of window-of-implantation markers in OFELs cultured with different media. Ctrl: Control medium, E: Estradiol, P: Progesterone, C: cAMP, X: XAV-939. Expression levels were normalized relative to the housekeeping gene GAPDH and the control condition. n = 2 independent experiments. The colors depict the data from 3 different donors. e. Heatmap of key cell cycle and secretory epithelial genes differentially expressed between stimulated and non-stimulated OFELs in bulk transcriptome. f. Staining for incorporated EdU (Red) reflective of cell proliferation in a stimulated OFEL (left). Scale bar: 50 μm. Quantification of the number of EdU+ cells in non-stimulated and stimulated OFELs (right). Counterstain with Hoechst marking DNA. n=4 independent experiments. mean± S.D.; Unpaired two-tailed t-test, *** is P = 0.0009. g. Quantification of blastoid attachment onto OFELs prepared using endometrial organoids from 3 different donors. n=3 independent experiments for donor 1 and n=2 independent experiments for donor 2 and 3; mean± S.D.; Unpaired two-tailed t-test, ** is P =0.0011. h. Immunofluorescence stainings for MUC1 (Magenta), a glycoprotein that highly expresses at the luminal epithelial surface of endometrium in the receptive phase46, with an attached GFP+ blastoid (48 h after deposition onto an OFEL). Dashed lines indicate the area that trophoblast cells repelled endometrial cells. Scale bar: 200 μm i. Quantification of blastoid attachment onto non-stimulated, stimulated OFELs, and OFELs additionally exposed to the contraceptive Levonorgestrel (LNG, 10 μM). n=3 independent experiments. mean± S.D.; one-way Anova and Tukey’s multiple comparisons test, * is P = 0.0211, *** is P = 0.0006.

