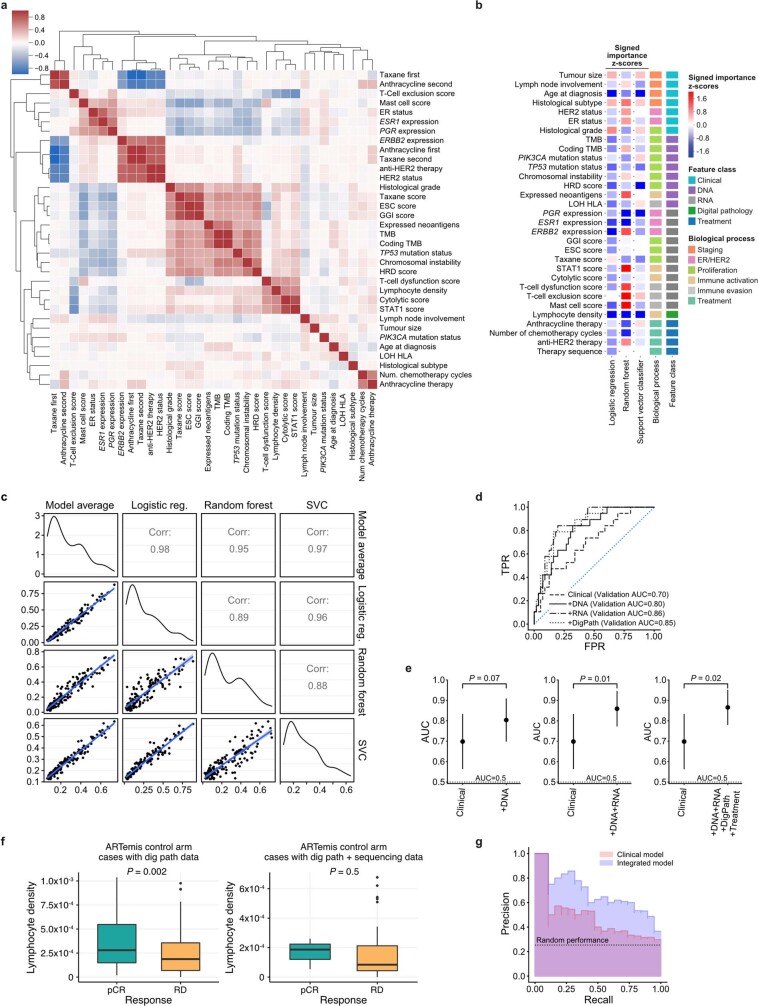
Extended Data Fig. 9. Machine learning model performance.
a, Correlation plot showing the results of unsupervised clustering between all the features explored. b, Signed feature importance split by algorithm. Negative numbers (blue) signify a decrease in AUC as a result of dropping, and therefore indicate that the feature improves the performance. c, Correlation of the three classification pipeline scores across the training dataset. Two-sided P values of all correlations < 2.2 x 10⁻¹⁶. d, Receiver-operating characteristic curves for the clinical and integrated models applied on the external validation cohort. e, Comparison between AUCs of the clinical model and models with different levels of data integration. The measure of centre is the parameter estimate and error bars represent 95% DeLong confidence intervals. f, Association between lymphocyte density and treatment response in ARTemis patients with digital pathology and sequencing data (right, n = 38 cases) vs. patients with only digital pathology available (left, n = 313 cases). The box bounds the interquartile range divided by the median, with the whiskers extending to a maximum of 1.5 times the interquartile range beyond the box. Outliers are shown as dots. P values obtained from Wilcoxon rank sum tests. g, Precision-recall curves of the clinical and fully integrated models applied on the test cohorts. The average precision values are 0.46 (clinical model) and 0.68 (fully integrated model). The areas under the precision-recall curves are 0.43 (clinical model) and 0.67 (fully integrated model).

